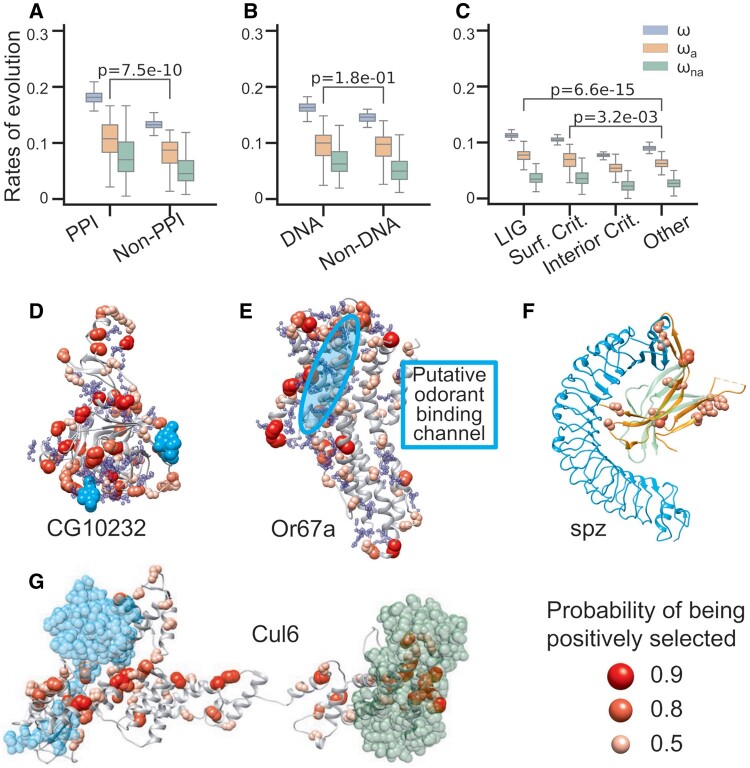
Fig. 1.
Adaptive evolution in molecular interaction sites. PPI sites (A), DNA binding sites (B), and putative ligand binding sites (C) show higher adaptation rates than none binding sites. The t-test P-values between the adaptation rates of binding sites and nonbinding sites were highlighted in (A–C). t-test P-values between other evolutionary rates of binding sites and nonbinding sites were shown in supplementary figure S2, Supplementary Material online. Examples of positive selection around molecular interaction sites in high-quality structural models of CG10232 (D), Or67a (E), spz (F), and Cul6 (G). Except for spz (PDB code 3e07), the other proteins are obtained from SWISS model repository. Putative ligand binding pockets of CG10232 (D) and Or67a (E) are shown in blue spheres. Ligands including interacting proteins are shown in cyan or green: NAG of CG10232 in cyan (D), Toll receptor of spz in cyan (F), Rbx protein in cyan and F-box protein in green for Cul6 (G). The putative odorant binding channel of Or67a is highlighted in cyan circle (E). The ligand poses in (D, F, and G) are obtained by superimposition from structures 2XXL, 4BV4, and 1LDK, respectively.

