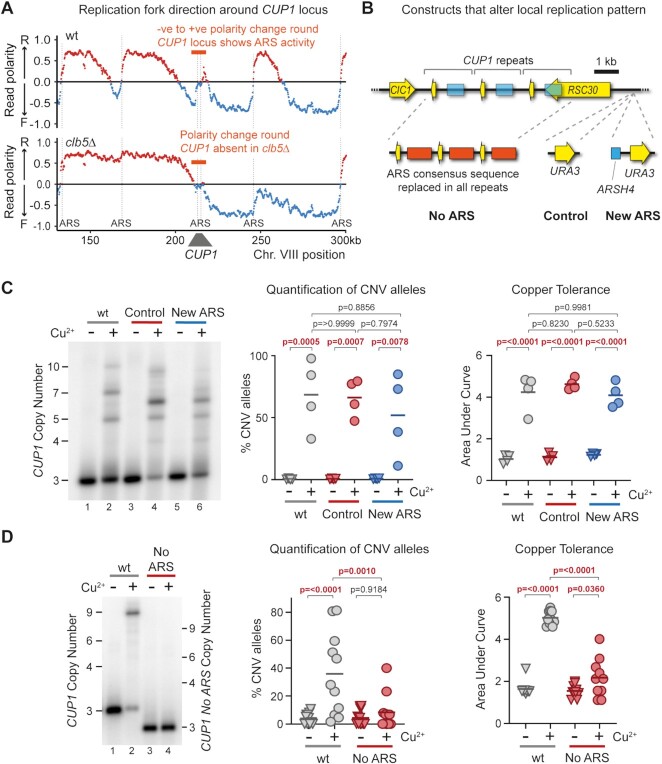
Figure 7.
Local Replication origin firing regulates CNV at CUP1 locus. (A) TrAEL-seq read polarity plots for wild type and clb5Δ cells grown to mid log in 2% Glucose. TrAEL-seq detects replication direction, an excess of reverse (R) reads at any site (indicated by positive polarity, red), results from replication forks moving left-to-right, the opposite for replication forks moving right-to-left (blue). Sharp transitions from –ve to +ve occur at active replication origins (ARS elements), gradual transitions from +ve to –ve are regions where forks converge. Plots show regions surrounding CUP1 on chromosome VIII, quantified by (R-F)/(R + F) with R and F referring to Reverse and Forward reads respectively; n = 2, data from GSE154811. (B) Schematic of the three copy CUP1 array and the modifications introduced to influence local replication pattern. In ‘No ARS’ cells, the region containing the endogenous ARS upstream of every CUP1 repeat have been replaced by a non-expressed sequence derived from a GFP tagging plasmid. ‘New ARS’ and ‘Control’ cells have a URA3 marker integrated upstream of the RSC30 promoter, either with or without an efficient replication origin (ARSH4) respectively. TrAEL-seq data confirming activity of the new ARS is shown in Supplementary Figure S5A. (C) Southern blot analysis of CUP1 copy number in 3xCUP1 wild-type (wt), Control and New ARS cells (described in B). Cells were cultured for 10 generations ±0.3 mM CuSO4. Quantification shows the percentage of alleles deviating from the parental copy number, P-values calculated by one-way ANOVA. Copper adaptation was assessed by treating cells with varying concentrations of CuSO4 and incubating for 3 days, final OD600 was plotted against [CuSO4] and copper tolerance quantified as area-under-curve for each culture; p-values were also calculated by one-way ANOVA; n = 4. (D) Southern blot analysis of CUP1 copy number and growth curve analysis in 3xCUP1 wild-type (wt) and 3xCUP1 cells with the region containing the ARS sites replaced by unrelated sequence (described in B). Cells were cultured, CNV alleles and copper adaptation quantified as in (B), n = 10 for Southern blot analysis, n = 11 for growth curve analysis.

