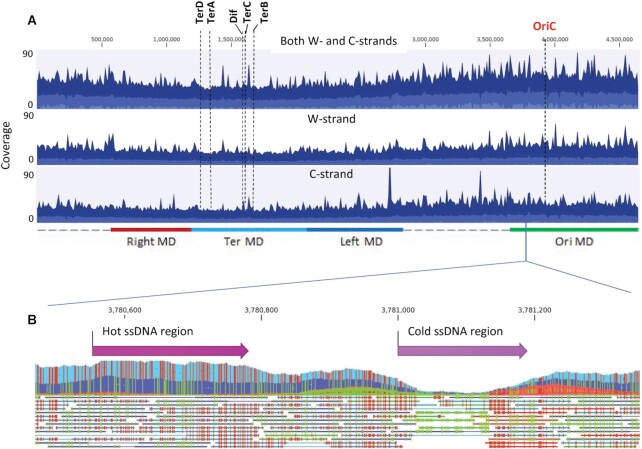
Figure 4.
Whole genome distribution of ssDNA gaps in E. coli. (A) Aggregated coverage graphs of mapped ssDNA reads for mid-log cells for both W- and C-strands (top panel), W-strand (middle panel) and C-strand (bottom panel). Blue color displays the average coverage values at the genome positions, dark blue – the maximum coverage values and light blue – the minimum coverage values. The origin of replication (OriC), Dif and replication termination sites TerA, TerB, TerC, TerD are indicated by dashed vertical lines. Approximate chromosomal boundaries of four macrodomains (Ori MD – green, Ter MD – cyan, Left MD – blue, Right MD – red) are indicated at the bottom. (B) A zoom-in genomic segment containing a hot ssDNA region and a cold ssDNA region. Each line below the aggregated graph represents an aligned ssDNA read. Green indicates the C to T conversion and red indicates G to A conversions in the aggregated data and in individual ssDNA reads.

