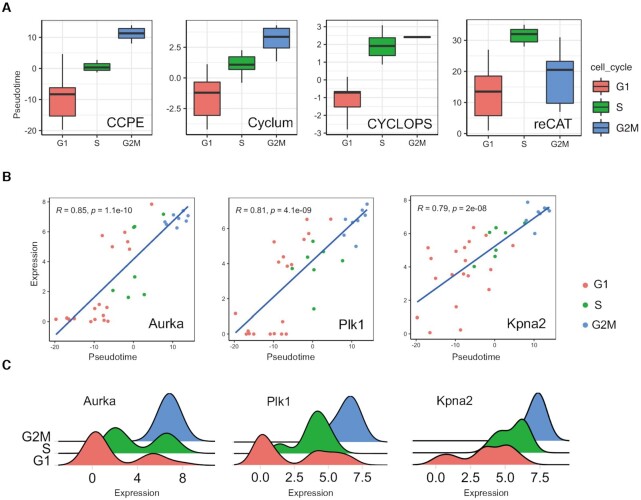
Figure 2.
Cell cycle pseudotime analysis of mESCs Quartz-Seq data. (A) Boxplots demonstrated the distribution of cell cycle pseudotimes inferred by CCPE, Cylum, CYCLOPS and reCAT, respectively. Each box was colored by the corresponding cell cycle phases and outliers were ignored in the figure. (B) The expressions of three cell cycle marker genes are highly correlated with the cell cycle pseudotime estimated by CCPE. The correlation coefficients and p-value are shown on the top left of each figure. (C) shows density plots of the expressions of three G2/M-phase marker genes.

