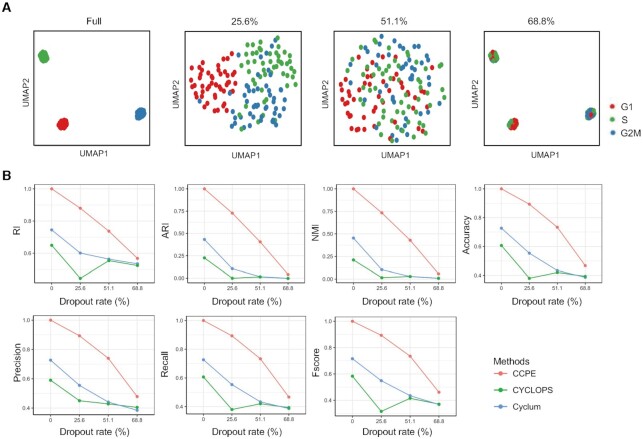
Figure 5.
Robustness of CCPE in dealing with dropout events in simulated datasets. (A) UMAP plots for data with 0%, 25.6%, 51.1% and 68.8% dropout rate. Full represents the data without dropout events. Cells were colored by CCPE-inferred cell cycle stages. (B) The impact of dropout rate on the performance of CCPE, Cyclum and CYCLOPS evaluated by seven multiclass classification metrics using simulated datasets. The methods are marked with different colors.

