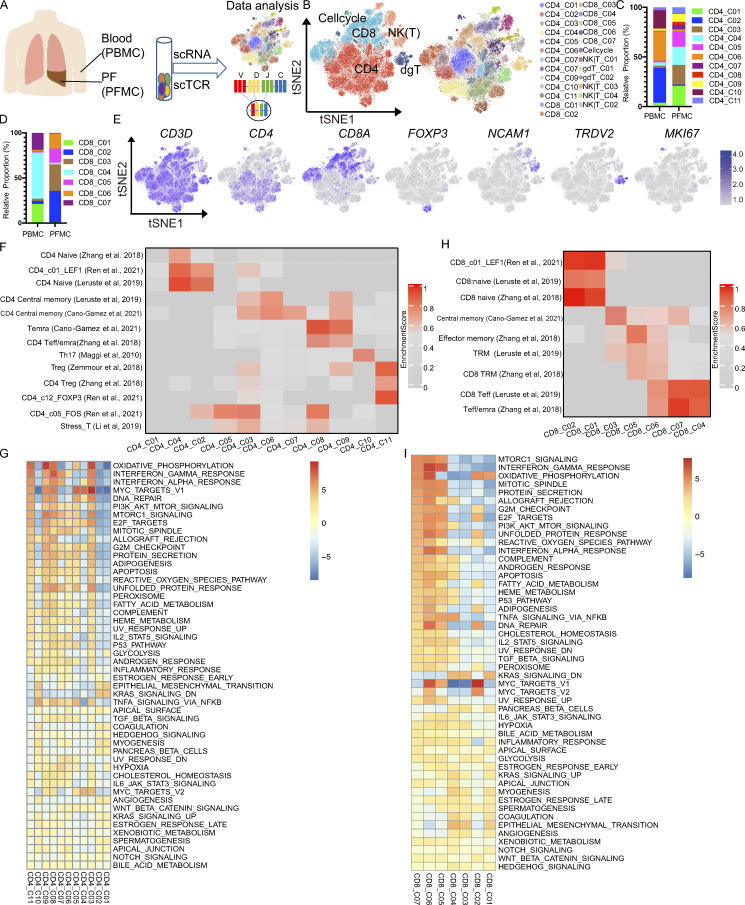
Figure 1.
Single-cell immune profiling of T cell heterogeneity in TPE. (A) The experimental workflow for defining and comparing T cells between the blood and PF in TPE. (B) tSNE of the T cell profile, with each cell color-coded for the main cell types and associated cell subsets from four TPE patients (PBMC, n = 3; PFMC n = 4). (C) The fraction of cells for CD4 T cell subsets in blood and PF from four TPE patients. (D) The fraction of cells for CD8 T cell subsets in blood and PF from four TPE patients. (E) tSNE plot of expression levels of selected genes in different clusters indicated by the colored oval. (F and G) Individual cell enrichment of indicated selected signatures or marker genes from published dataset; the enrichment scores are shown in the heatmap. (F) CD4 subsets. (G) CD8 subsets. Temra, effector memory or effector; Teff, effector; Trm, tissue resident memory. (H) Differences in pathway activities scored per cell by GSEA between the different CD4 T clusters from four TPE patients. (I) Differences in pathway activities scored per cell by GSVA between the different CD8 T clusters from four TPE patients.

