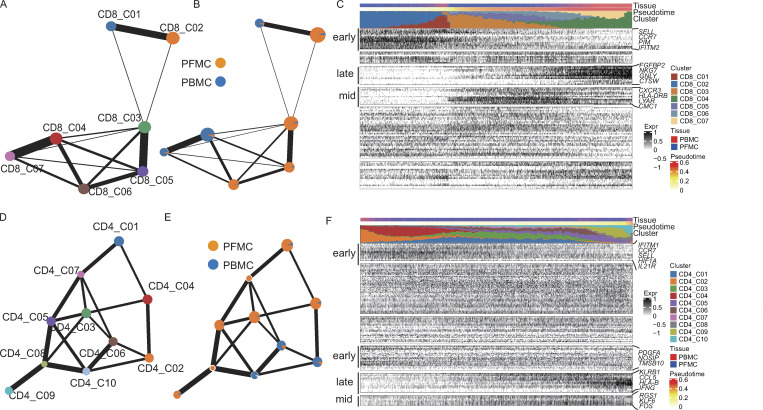
Figure 2.
Pseudo-time analysis reveals distinct CD4 and CD8 T cell differentiation trajectories in PBMCs and PFMCs. (A and B) PAGA analysis of CD8 T cell pseudo-time: the associated cell type (A) and the corresponding status (PBMC, n = 3; and PFMC, n = 4; B) are shown. (C) Reconstructed PAGA paths for the differentiation of the identified CD8 T cells from TPE. (D and E) PAGA analysis of CD8 T cell pseudo-time: the associated cell type (D) and the corresponding status (PBMC and PFMC; E) are shown. (F) Reconstructed PAGA paths for the differentiation of the identified CD4 T cells from TPE.

