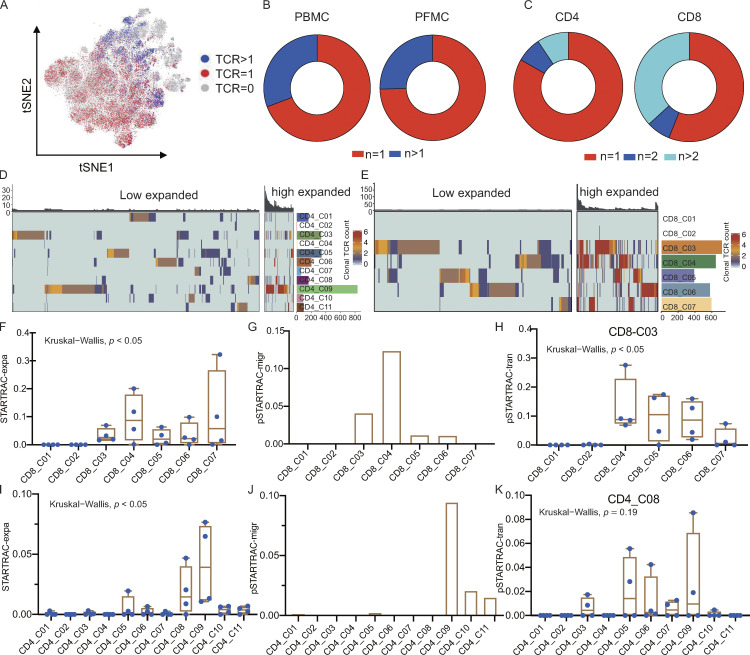
Figure 3.
TCR distribution and clonality analysis. (A) The TCR distribution of T cells. Gray (n = 0), red (n = 1), and blue (n > 1). (B and C) TCR distribution in different tissue types (B) and cell types (C). (D and E) Phenotypic analysis of low expanded (TCR <5) and high expanded (TCR ≥5) clonotypes in CD4 and CD8 T cell subsets. Individual T cells are grouped by TCR sequence; each bar above the heatmaps represents a distinct TCR sequence. (F) Clonal expansion levels of CD8 T cell clusters quantified by STARTRAC-expa for each patient (n = 4); Kruskal–Wallis H tests were performed to analyze differences in the STARTRAC results. (G) Migration potentials of CD8 subsets by pSTARTRAC-migr indices between blood and PF. The shared clonotypes in each CD8 subset (all patients combined) between blood and PF was analyzed by pSTARTRAC-migr. (H) Developmental transition of CD8_C03 cells with other CD8 cells, quantified by pSTARTRAC-tran indices for each patient (n = 4); Kruskal–Wallis H tests were performed to analyze differences. (I) Clonal expansion levels of CD4 T cell clusters quantified by STARTRAC-expa for each patient (n = 4); Kruskal–Wallis H tests were performed to analyze differences. (J) Migration potentials of CD4 subsets by pSTARTRAC-migr indices between blood and PF. The shared clonotypes in each CD4 subset (all patients combined) between blood and PF was analyzed by pSTARTRAC-migr. (K) Developmental transition of CD4_C08 cells with other CD4 cells quantified by pairwise STARTRAC-tran indices for each patient (n = 4). Kruskal–Wallis H tests were performed to analyze differences.

