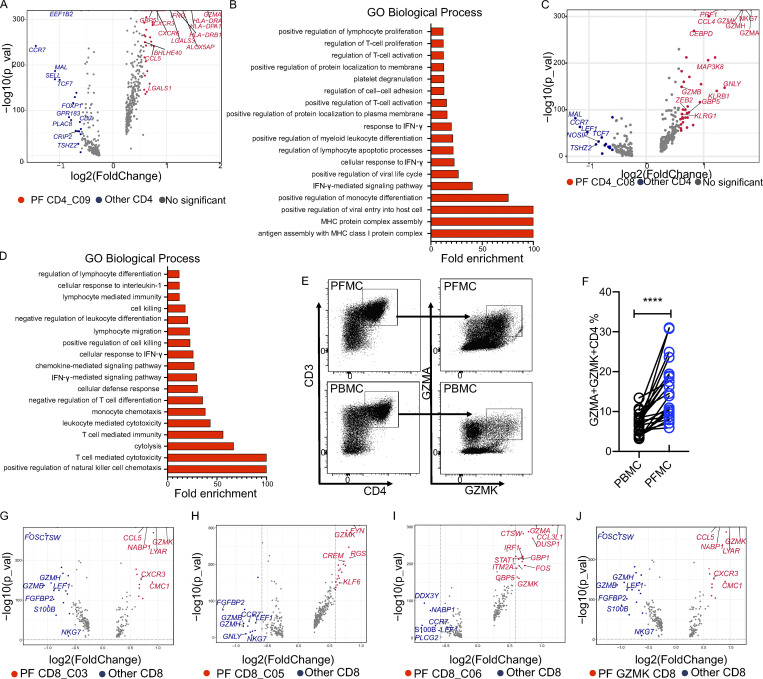
Figure 5.
Gene expression characterization associated with PF-infiltrating T cells. (A) Volcano plot showing DEGs in PF CD4_C09 versus other CD4 T cells (n = 4). Each red dot denotes an individual gene passing P value (val) and fold-difference (P < 0.01; average fold-change >1.5) thresholds. (B) GO analysis of genes positively expressed in PF CD4_C09. (C) Volcano plot showing DEGs in PF CD4_C08 versus other CD4 T cells (n = 4). Each red dot denotes an individual gene passing P value and fold-difference thresholds. (D) GO analysis of genes positively expressed in PF CD4_C08. (E) Gating strategy for GZMK+GZMA+ CD4 T cells by flow cytometry. (F) The frequency of GZMK+GZMA+ CD4 T cells in paired PBMCs and PFMCs from TPE patients (n = 22). A paired t test was used to analyze differences in paired samples; ****, P < 0.0001. (G–J) Volcano plot showing DEGs in CD8_C03 (G), CD8_C05 (H), CD8_C06 (I), and GZMK-expressing CD8 (J). Each red or blue dot denotes an individual gene passing P value and fold-difference thresholds (P < 0.01; average fold-change >1.5).

