Figure S1.
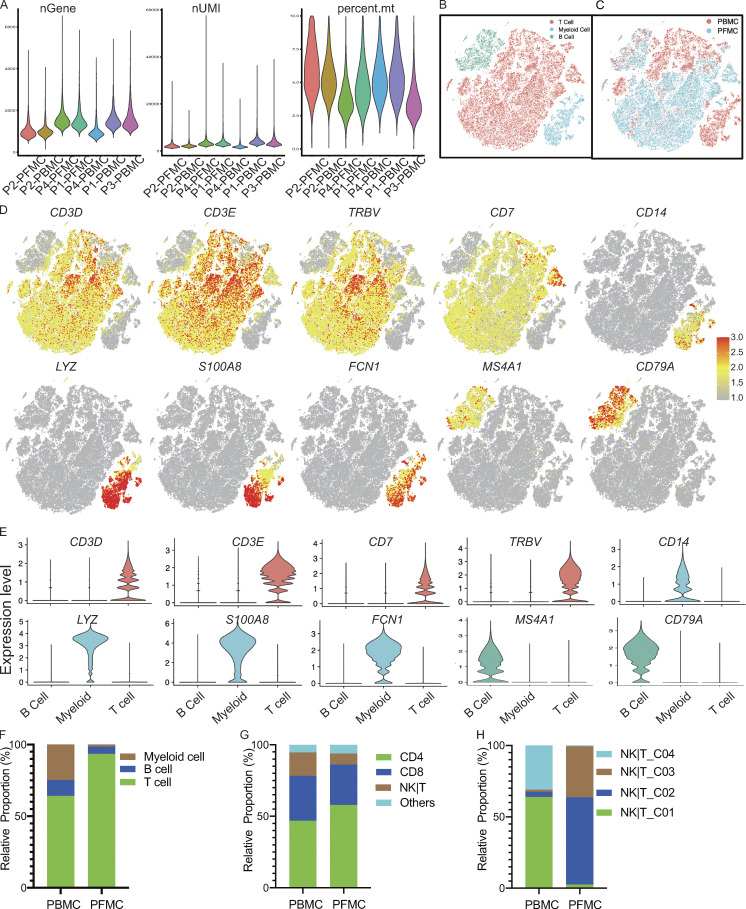
scRNA-seq of cells from TPE. (A) Consistency of cell capture and identification in scRNA-seq. Number of UMIs (nUMIs) and genes (nGene) identified and fraction of reads mapped to mitochondrial (mt) genes across all samples (n = 4). (B) All samples merged single cells with the associated main cell types. (C) All samples merged single cells with the corresponding tissues (PBMCs and PFMCs). (D) tSNE plot of expression levels of selected genes in different cell types indicated by the colored ovals. (E) Violin plot of expression levels of selected genes in different cell types. (F) The relative proportion of cells for main cell types in blood and PF from TPE (n = 4). (G) The relative proportion of cells for T cell subsets in the T cell fraction in blood and PF from TPE (n = 4). (H) The relative proportion of cells for NK|T subsets in blood and PF from TPE (n = 4).

