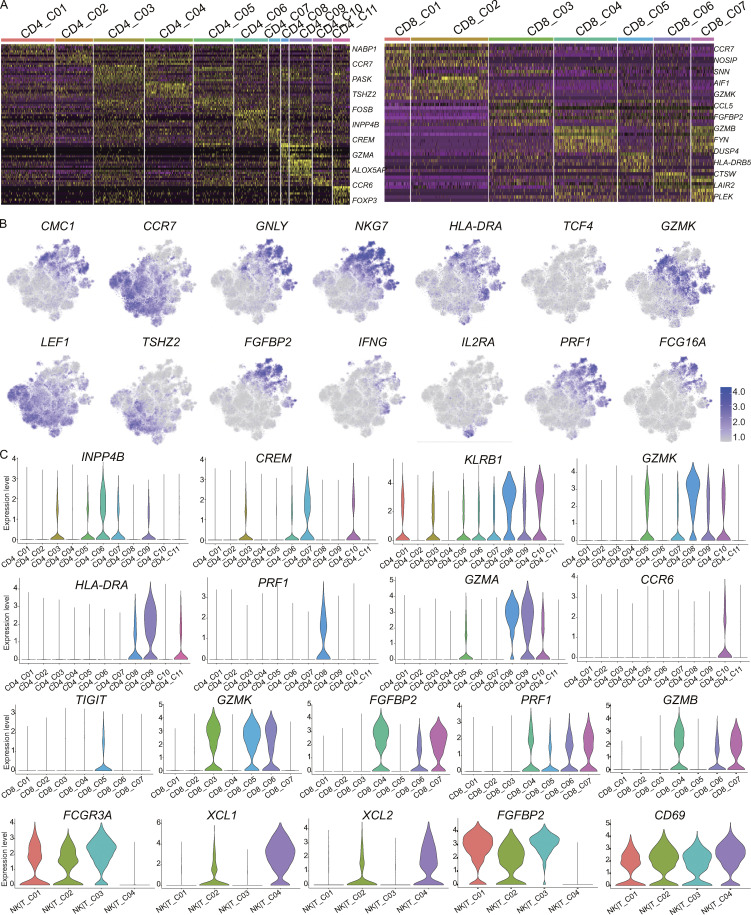
Figure S2.
Expression of marker genes for T cell subsets. (A) Differential expression analysis comparing CD4 subsets (left) and CD8 subsets (right) from the blood and PF. Heatmaps indicate the up- and down-regulated genes in CD4 T cell and CD8 T cell subsets, respectively. (B) tSNE plot of expression levels of selected genes in different cell subsets. (C) Violin plot of expression levels of selected genes in different cell subsets.

