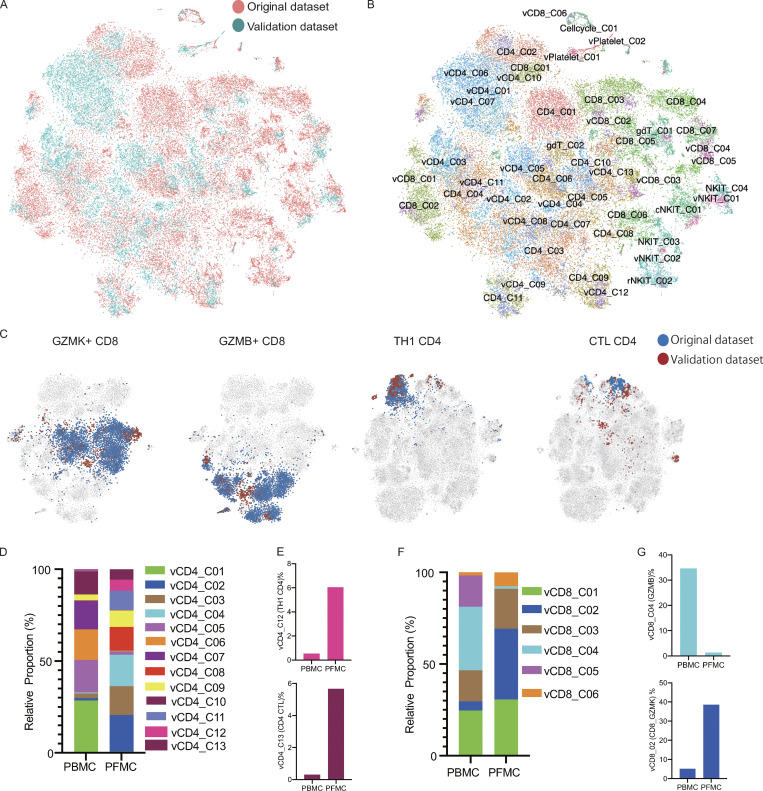
Figure S3.
Analysis of the validation dataset. (A and B) tSNE of the combined original (n = 4) and validation (n = 2) data with each cell color-coded for the different datasets (A) or associated cell subsets (B). For integrating two datasets, the datasets were normalized to find variable features using the R package Seurat (v3.2.0) with default parameters, and 30 PCs were selected for the tSNE analysis, with default parameters. CD4/CD8 from the original dataset; vCD4/vCD8 from the validation dataset. (C) tSNE of the GZMK-expressing CD8, GZMB-expressing CD8, Th1 CD4, and CTL CD4 T cells from the original and validation datasets. (D) The relative proportion of cells of the CD4-cell subsets in the T cell fraction of the validation dataset (n = 2). (E) The fraction of cells for Th1 CD4 and CTL CD4 in CD4 T cells from blood and PF in the validation dataset (n = 2). (F) The relative proportion of cells of the CD8 T cells subsets in the T cell fraction of the validation dataset (n = 2). (G) The fraction of cells of the GZMB-expressing CD8 and GZMK-expressing CD8 T cells in CD8 T cell from blood and PF in the validation dataset (n = 2).

