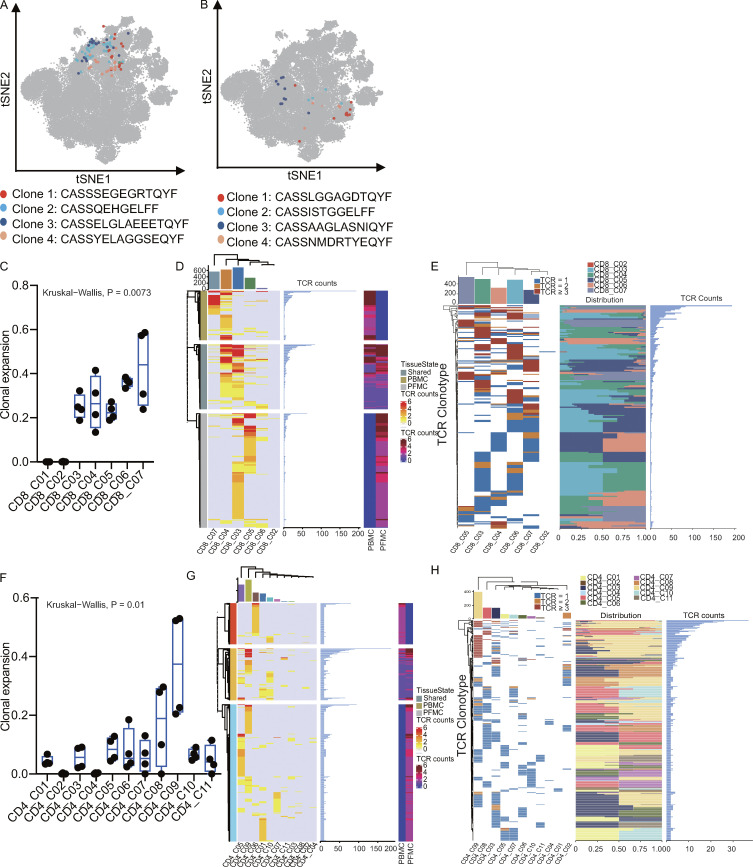
Figure S5.
Analysis of TCR expansion and sharing status between subsets or tissues. (A) The spatial distribution of cells, showing only those CD8 T cells sharing the same TCRs in colors. (B) The spatial distribution of cells, showing only those CD4 T cells sharing the same TCRs in colors. Four different clonotypes are shown, with different colors. (C) The percentage of clonal expansion in CD8 T cell clusters. Clonal expansion rate = total of cells in expansion clonotypes (TCR > 1) cells ÷ total of cells with TCR. (D) Analysis of shared clonotypes in CD8 T cells between PBMCs and PFMCs. Left: PBMC specific TCRs (top), shared PBMC and PFMC TCRs (middle), and PFMC-specific TCRs (bottom) in CD8 T cell subsets. Middle: The number of cells with identical TCRs for each clonotype from the left panel. Right: The distribution of different clonotypes in PBMCs and PFMCs (PBMC, n = 3, PFMC, n = 4). (E) Analysis of shared clonotypes in CD8 subsets. Left: TCR sequences are grouped by CD8 subsets; each bar in the heatmaps represents a distinct TCR sequence. Middle: The distribution of cells with identical TCRs in CD8 T cell subsets. Right: The number of cells with identical TCRs for each clonotype from left panel. (F) The percentage of clonal expansion in CD4 T cell clusters. (G) Analysis of shared clonotypes in CD4 T cell between PBMCs and PFMCs. Left: PBMC-specific TCRs (top), shared PBMC and PFMC TCRs (middle), and PFMC-specific TCRs (bottom) in CD4 T cell subsets. Middle: The number of cells with identical TCRs for each clonotype from the left panel. Right: The distribution of different clonotypes in PBMCs and PFMCs. (H) Analysis of shared clonotypes in CD4 subsets. Left: TCR sequences are grouped by CD4 subsets; each bar in the heatmaps represents a distinct TCR sequence. Middle: The distribution of cells with identical TCRs in CD4 T cell subsets. Right: The number of cells with identical TCRs for each clonotype from the left panel.

