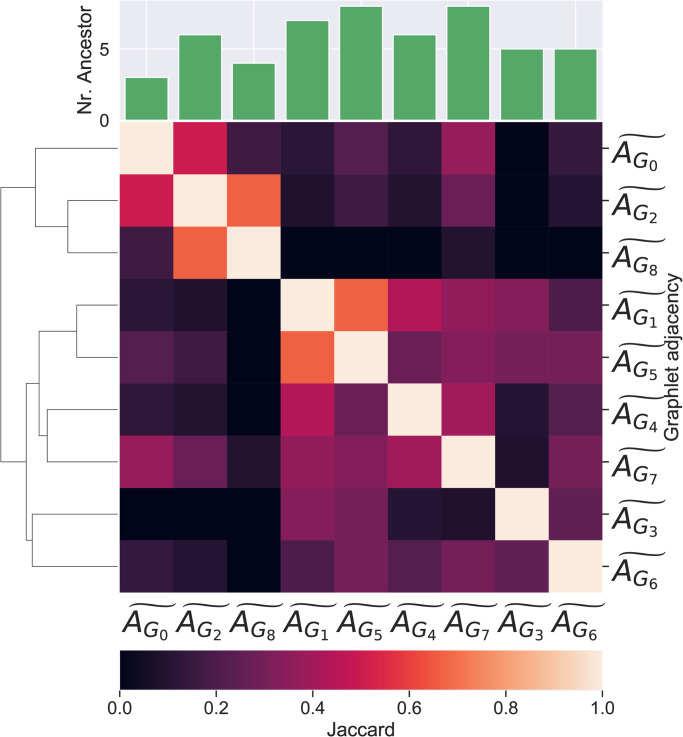
Fig 4. The overlap between correctly predicted cancer genes in pathways described by central cancer genes based on different graphlet adjacencies.
A clustered heat map of the Jaccard similarity indices between the sets of correctly predicted cancer genes found in pathways described by central driver genes based on different types of graphlet adjacencies. At the top, the bar-chart indicates the number of correctly predicted genes corresponding to each graphlet adjacency.

