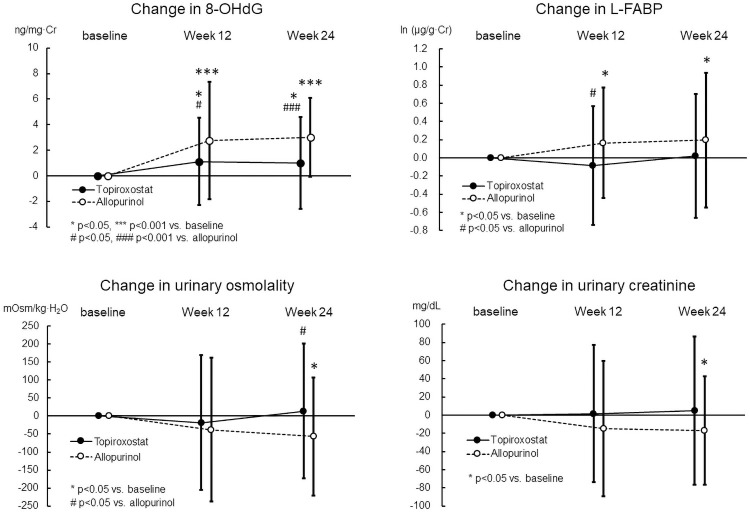
Fig 2. Serial changes of urinary 8-OHdG, L-FABP, osmolality and creatinine levels at weeks 12 and 24.
Values are mean ± standard deviation. For the changes in the values 24 weeks from baseline were assessed using the paired Student’s t-test in each group. For the difference between both groups analyzed using the unpaired t-test.

