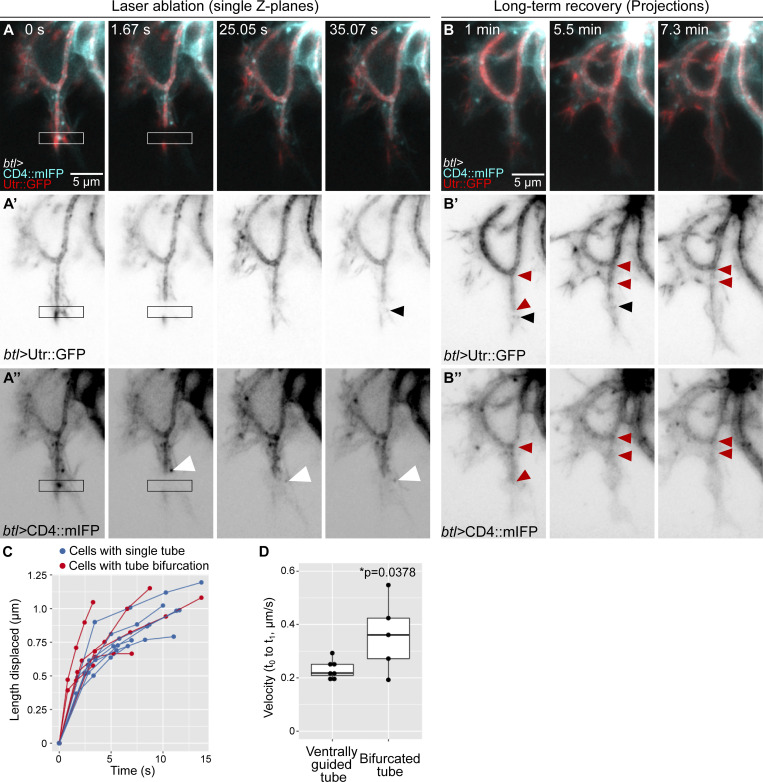
Figure S4.
Infrared laser ablation at the tip of terminal cells with bifurcated tubes. (A and B) Terminal cell expressing Utr::GFP (A' and B') and CD4::mIFP (A'' and B'') under btl-gal4. White arrowheads point to CD4 vesicles; black arrowheads point to actin vesicles. (A) Cell immediately before laser cut. Black and white boxes mark the laser-ablated region. (B) Long-term recovery, z-projections. Red arrowheads show the tip and the base of the ventral tube. (C and D) Quantification of the recoil as determined by length displacement over time, using manual tracking. (C) Time course. (D) Initial velocity. Box plots represent median, IQR, and IQR*1.5 below and above the IQR. Number of cells analyzed: cells with properly guided tube, n = 7; cells with bifurcated tube, n = 5. Significance was assessed using t test. Ventral is down.

