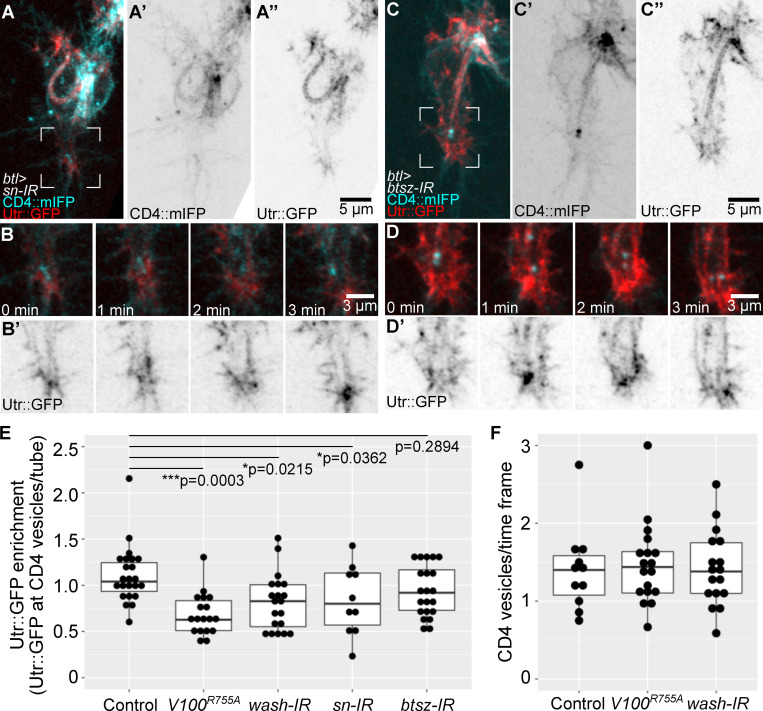
Figure S5.
Actin organization in cells with defective actin-binding proteins. (A–D) Cells expressing CD4::mIFP (A' and C') and Utr::GFP (A'', B', C'', and D') under btl-gal4. (A and B) sn knockdown. (C and D) btsz knockdown. Regions marked in A and C are magnified and shown over four time points in B and D, respectively. (E) Mean Utr::GFP fluorescence intensity in CD4 vesicles over time. Values were normalized to fluorescence intensity at the tube to adjust for variations in the expression of the Utr::GFP reporter. Number of vesicles analyzed: control, n = 23 from nine cells; Vha100R755A (V100R755A), n = 19 from eight cells; wash-IR, n = 20 from nine cells; sn-IR, n = 10 from five cells; and btsz-IR, n = 20 from eight cells. Values at the top are significance between genotypes, assessed by ANOVA and Tukey correction for multiple comparisons. (F) Mean number of CD4 vesicles at the tip of the cell per time point (4–28 time points per cell). Control cells, n = 11; Vha100R755A, n = 18; wash RNAi, n = 17. Box plots represent median, IQR, and IQR*1.5 below and above the IQR. Ventral is down.

