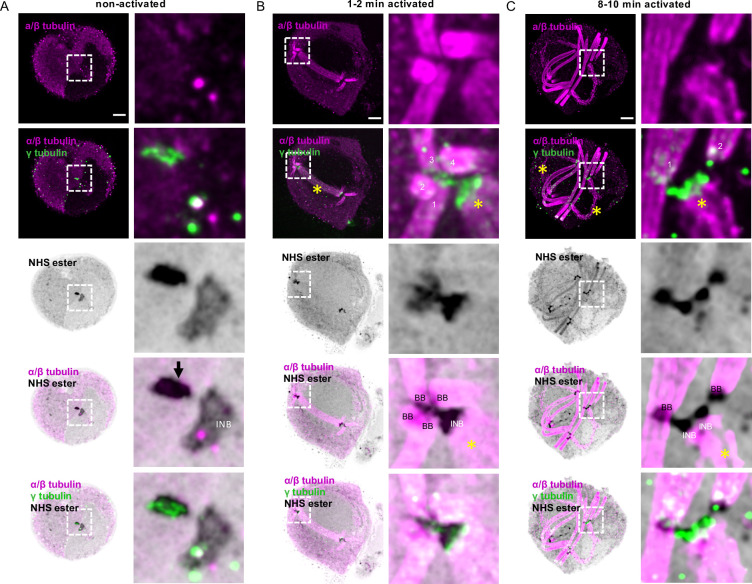
Fig 5. γ-tubulin displays dynamic localisation from the amorphous MTOC to basal bodies and intranuclear bodies during P. berghei microgametogenesis.
A-C. Representative full projections of non-activated and activated P. berghei gametocytes. α/β-tubulin: magenta; amine reactive groups/NHS-ester: shades of grey; γ-tubulin: green. Boxed areas indicate area shown in zoom for each image, highlighting the basal bodies (BB), the amorphous MTOC (black arrow), the intranuclear body (INB) stained with NHS-ester, γ-tubulin and α/β-tubulin. Individual axonemes are numbered 1–4. The yellow asterisks highlight mitotic spindles. Scale bars = 5 μm.

