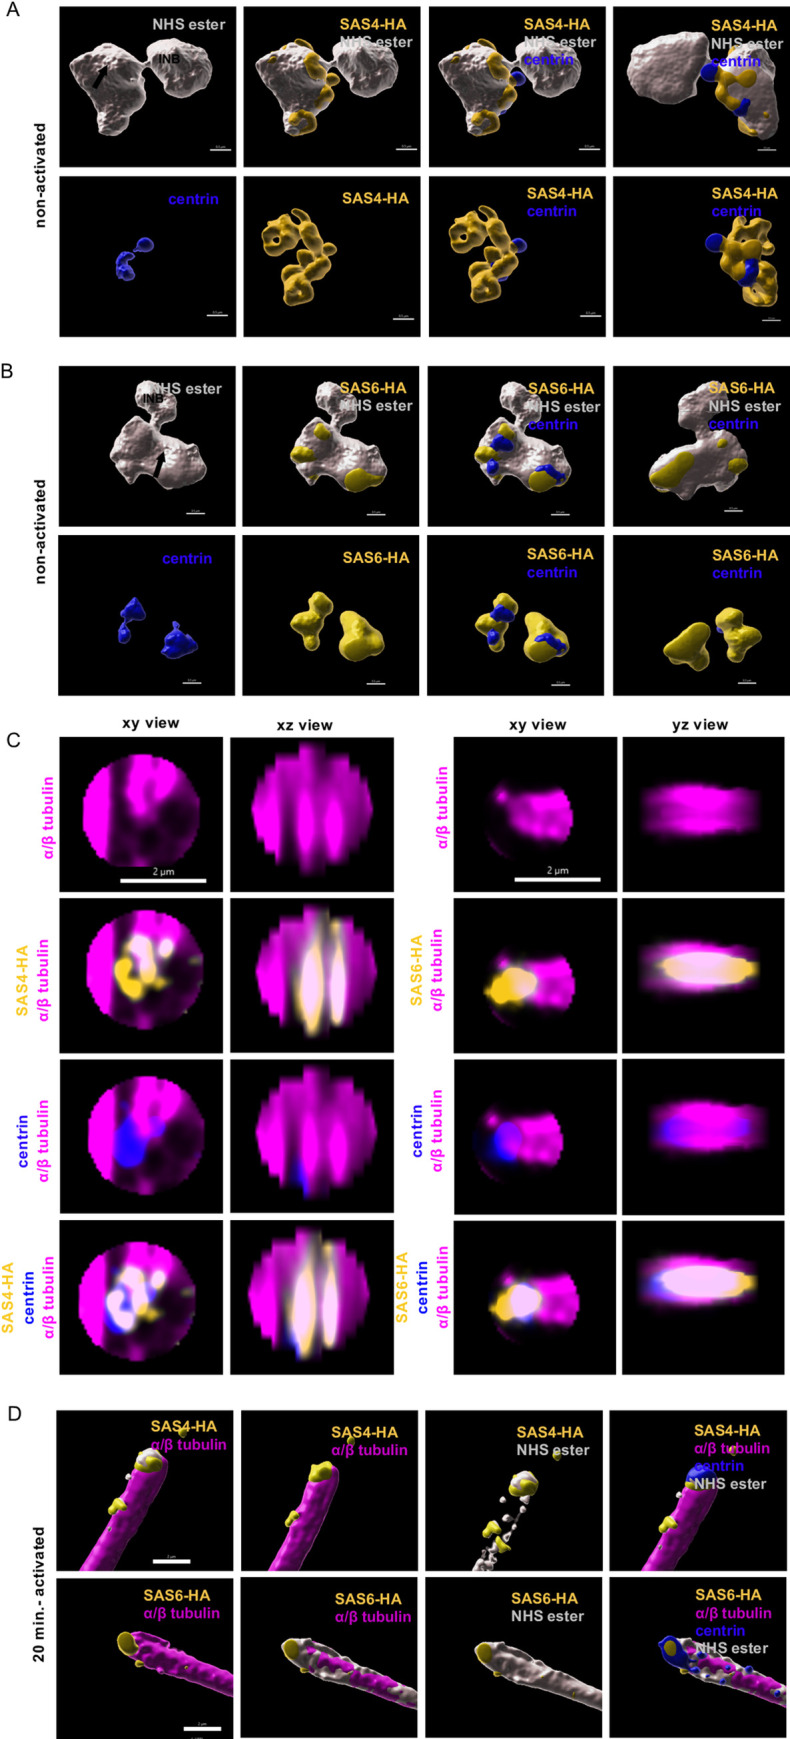
Fig 7. 3D reconstruction of the bipartite MTOC during P. berghei microgametogenesis.

A and B. 3D surface topology of the amorphous MTOC and intranuclear body of non-activated microgametocytes shown in Fig 6. Amine reactive groups/NHS-ester: shades of grey; centrin: blue; yellow: SAS4-HA (A) or SAS6-HA (B); amorphous MTOC: black arrow; intranuclear body: INB. Scale bar = 0.5 μm. C. xy and xz or yz views of individual basal bodies in 10–12 min activated microgametocytes, SAS4-HA (left) and SAS6-HA (right). Scale bar = 2 μm. D. 3D surface topology of exflagellated microgametes of Fig 6, SAS4-HA (top row) and SAS6-HA (bottom row). Scale bar = 2 μm.
