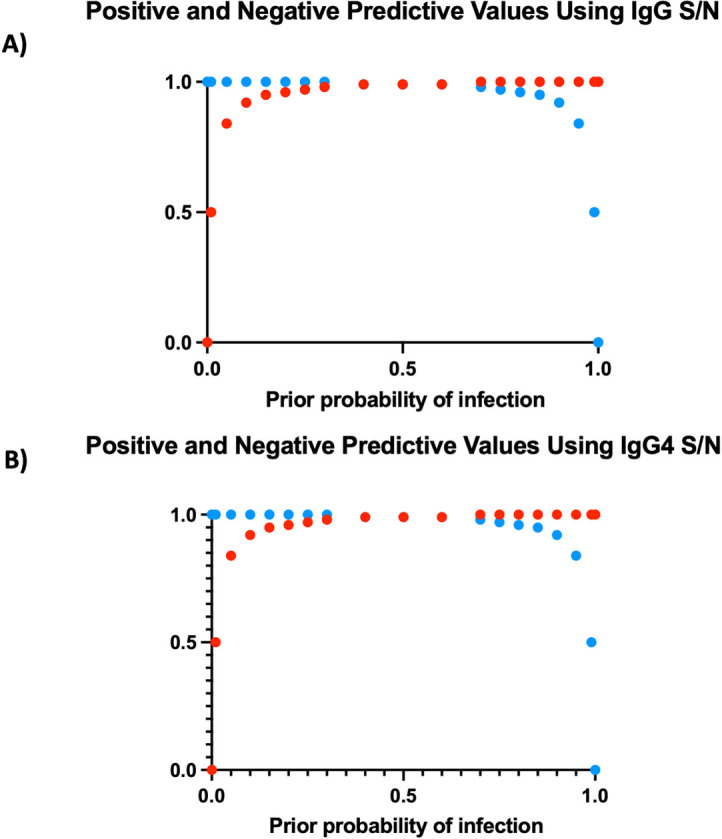
Fig 2. A comparison between the optimal cutoffs of the IgG and IgG4 based assays and their predicted positive (PPV) and negative predictive values (NPV) for a given prevalence.

Using the calculated cutoff value, a plot of the positive and negative predictive values for a given prior probability of infection was calculated using IgG S/N (A) and IgG4 S/N (B). (Blue = NPV; Red = PPV).
