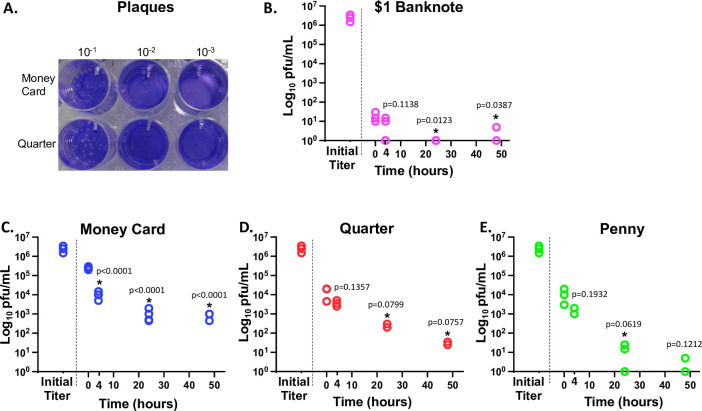
Fig 1. Stability of live SARS-CoV-2 virus on $1 U.S.A. banknotes, money cards, quarters, and pennies.
A) Representative plaques of a SARS-CoV-2 on VERO cells from this study at the four-hour time point. B) Recovery of virus after inoculation of $1 U.S.A. banknotes at time zero (after 0.5 hour) then 4, 24 and 48 hours. C) Recovery of virus after inoculation of money cards at time zero (after 0.5 hour) then 4, 24 and 48 hours. D) Recovery of virus after inoculation of quarters at time zero (after 0.5 hour) then 4, 24 and 48 hours. E) Recovery of virus after inoculation of pennies at time zero (after 0.5 hour) then 4, 24 and 48 hours. Log10 of the virus concentration was represented on the y-axis of all charts to better display differences in numbers. At zero titer, log10 is undefined and is therefore shown at 100. Time 0.5 was used as an initial time point after inoculation to allow time for drying on each surface and post spotting titers are labeled as “initial titer”. ANOVA followed by post hoc Tukey HSD using JMP Pro (JMP®, Version 15. SAS Institute Inc., Cary, NC, 1989–2021) was used to detect differences between time points, and all significant differences (p< 0.10) between the time 0.5 hours and other time points as indicated by “*”. For every surface, the starting point (initial titer prior to inoculation) was significantly different (p<0.05) from all other time points.

