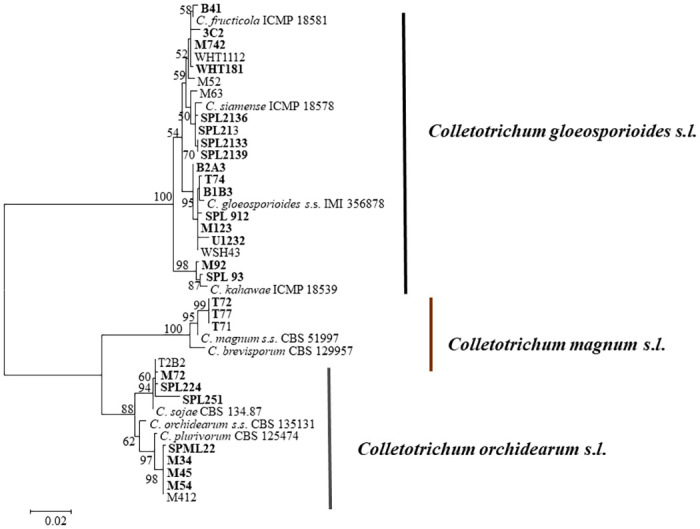
Fig 3. A maximum likelihood phylogenetic tree based on ITS, and TUB2 sequences from 32 isolates from OLA and representative isolates of the different Colletotrichum species complexes.

Bootstrap values ≥ 50% are shown at the nodes. The isolates selected for further phylogenetic analysis are shown in bold. The scale bar indicates 0.02 substitutions per site.
