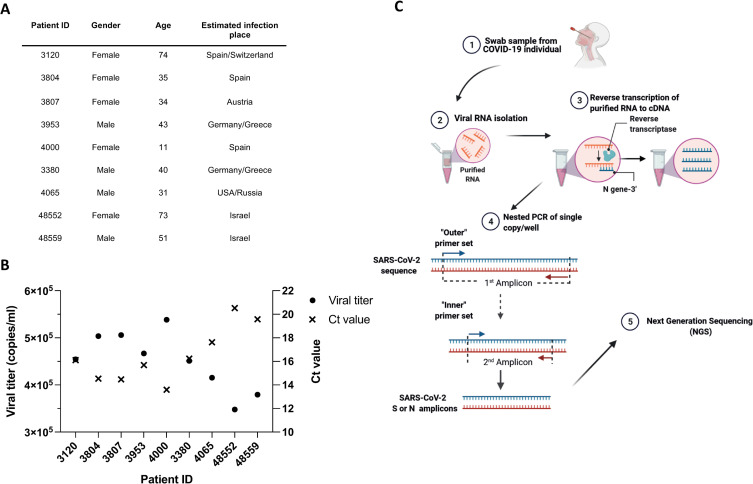
Fig 1. Study design and participants demographics.
(A) Detailed description of SARS-CoV-2-infected individuals from whom nose-throat swabs were isolated. The infected individuals are represented by the study ID. The geographic location where the individuals were infected is shown in the table. (B) Ct values (right y-axis) and viral titers (left y-axis) of SARS-CoV-2 in nose-throat swabs. Values were obtained by Real-Time Reverse Transcriptase-Polymerase Chain Reaction measurements that was performed during the clinical diagnostic of the swabs. The study ID of the infected individuals is shown in the x-axis. (C) Schematic representation SARS-CoV-2 SGS. RNA isolated from nose swabs was reverse transcribed into cDNA using SARS-CoV-2 specific primer (N-Out-3’). cDNA was diluted to single copy per well and subjected to a nested PCR to amplify single copies of SARS-CoV-2 S gene and N gene. PCR products were then sequenced by Illumina MiSeq. Figure was generated using biorender.com.

