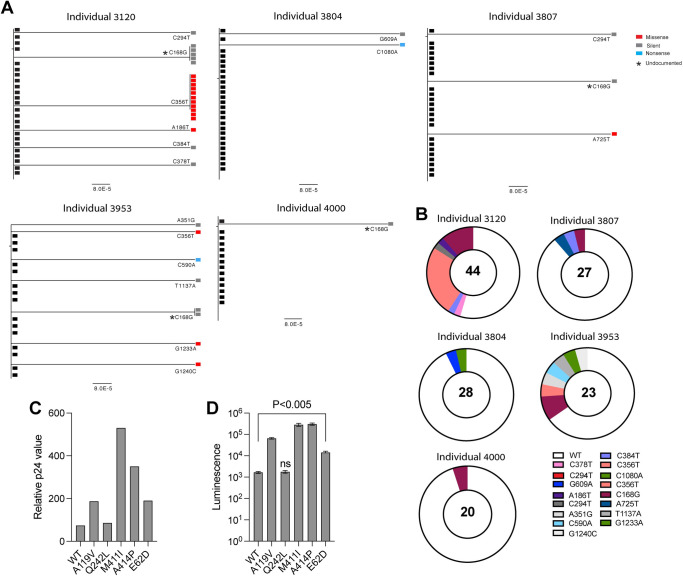
Fig 3. Intra-host SARS-CoV-2 N-gene diversity.
(A) Phylogenetic trees depicting N genes isolated from nose-throat swabs by SGS. IDs of individuals from whom swabs were isolated are indicated in the figure. Black rectangles depict the dominant N gene isolated from each swab sample. Red rectangles depict N genes with missense mutations, grey rectangles depict N genes with silent mutations and blue rectangles depict N genes with nonsense mutations. Mutations that are not documented in the GSAID are marked with an asterisk. For each N-gene variant, the nucleotide substitution is indicated (based on Wuhan-Hu-1 numbering). The segment with the number below each phylogenetic tree shows the length of branch that represents an amount genetic change. The amount of genetic change is the number of nucleotide substitutions divided by the length of the N-gene sequence. (B) Pie charts showing the proportion of all N-gene sequences isolated from each swab sample. The White pie slice depicts unmutated sequences. The Colored pie slices depict mutated N genes. The different mutations are indicated in the figure. The number in the middle of the pie chart depicts the total number of N-gene variants that were sequenced. (C) Relative p24 value as measured by adding 20 μl of supernatant containing the pseudovirus to Lenti-X GoStix Plus. The x-axis depicts the SARS-CoV-2 pseudoviruses that were produced, and the y-axis depicts the relative p24 protein (GoStix values) in the supernatant of each pseudovirus. (D) 293T-ACE2 infection with SARS-CoV-2 pseudovirses expressing mutated N proteins and unmutated (Wuhan-Hu-1) N protein (WT). The x-axis depicts the mutation in the N proteins of the pseudovirus that was used for infection. The y-axis depicts the luminescence levels that were measured 48 hours post infection. Experiments were done in triplicates and repeated three times. One representative experiment is shown. Mean values and standard errors are shown. Statistically significant differences in comparison to the WT SARS-CoV-2 pseudovirus are indicated (student’s t test, p < 0.005). Figure was generated using biorender.com.

