Figure 2.
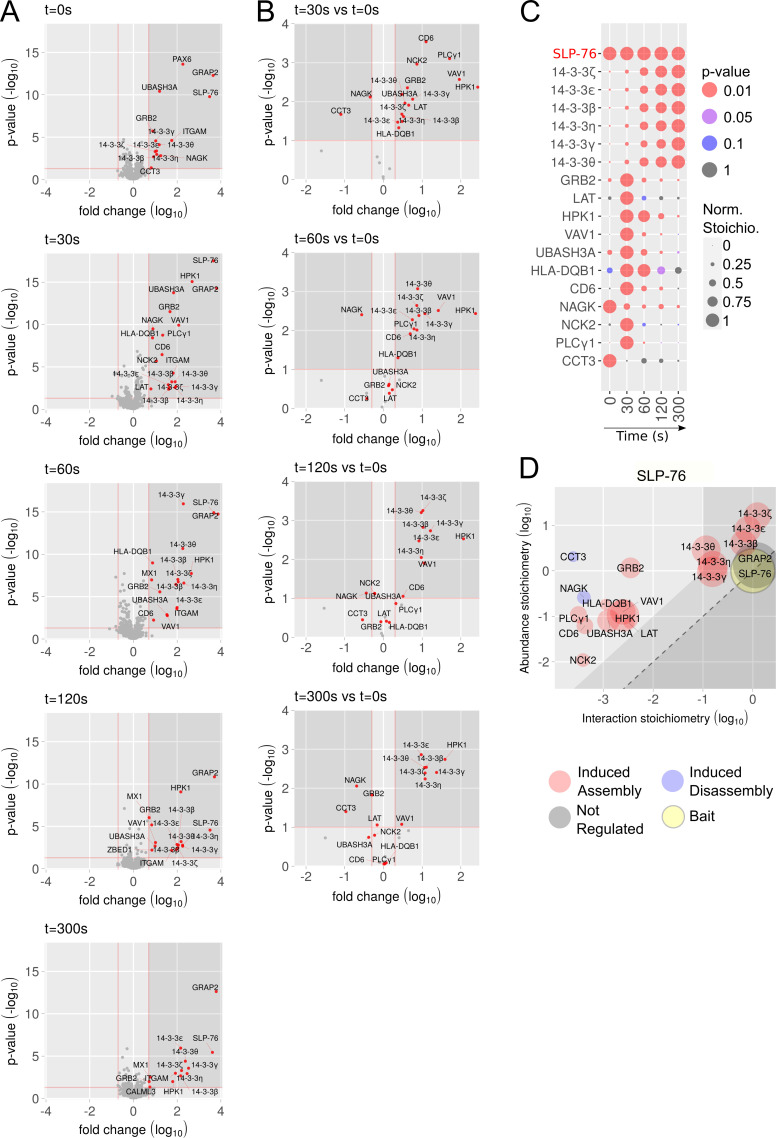
Composition, dynamics, and stoichiometry of the SLP-76 interactome of human primary CD4+ T cells. (A) Volcano plots showing proteins significantly enriched after affinity purification in CD4+ T cells expressing SLP-76OST molecules compared with affinity purification in control CD4+ T cells expressing similar levels of untagged SLP-76 proteins before (t = 0 s) and 30, 60, 120, and 300 s after TCR-CD28 stimulation. In A and B, the x and y axes show the average fold-change (in log10 scale) in protein enrichment and the statistical significance, respectively. (B) Volcano plots showing proteins significantly enriched after affinity purification in SLP-76OST CD4+ T cells 30, 60, 120, and 300 s after TCR-CD28 engagement compared with affinity purification in unstimulated SLP-76OST CD4+ T cells. The x and y axes show the average fold-change (in log10 scale) in protein abundance and the statistical significance, respectively. (C) Dot plot showing the interaction stoichiometry over the course of TCR-CD28 stimulation of SLP-76 with its 17 high-confidence preys, the interaction stoichiometry of which changed following TCR stimulation. For each SLP-76–prey interaction, the interaction stoichiometry has been row-normalized to its maximum value observed over the course of TCR-CD28 stimulation (see normalized stoichiometry [Norm. Stoichio.] key). Also shown is the P value of the specified interactions (see P value key). The roles of the NAGK, CCT3, and HLA-DQB1 prey proteins that are found in the SLP-76 interactome of human CD4+ T cells remain to be elucidated. (D) Stoichiometry plot of the SLP-76 interactome. The SLP-76 bait is shown as a yellow dot, the preys that associate to SLP-76 after TCR-CD28 stimulation are specified by a red dot, and the preys that dissociate from SLP-76 after TCR-CD28 stimulation are specified by a blue dot. GRAP2, whose association to SLP-76 is constitutive, is also shown and specified by a gray dot. For each of the 17 TCR-regulated SLP-76–prey interactions, the ratio of prey to bait cellular abundance (abundance stoichiometry in log10 scale) was plotted as a function of the maximal interaction stoichiometry reached by the considered SLP-76–prey interaction over the course of TCR-CD28 stimulation (interaction stoichiometry in log10 scale). For instance, SLP-76 (893,261 copies per T cell; column I of the SLP76.CD4 tab in Data S1) is more abundant than LAT (62,934 copies per T cell), giving a ratio of prey to bait cellular abundance of −1.15 in log10 scale. Moreover, the maximal stoichiometry of the SLP-76–LAT interaction is reached at t = 30 s and corresponds to 0.0033 (−2.48 in log10 scale; column F of the SLP-76.CD4 tab in Data S1). Therefore, 2,954 (0.0033 × 893,261) molecules of SLP-76 are complexed to LAT at t = 30 s. As a result, 4.7% (2,947/62,934 × 100) of the available LAT proteins are complexed to SLP-76 30 s after TCR-CD28 engagement. The area including the SLP-76–prey interactions involving >10% of the available prey molecules is indicated in light gray and includes GRAP2 and six members of the 14-3-3 family (14-3-3 ζ, ε, β, η, γ, and θ). The limit imposed on interaction stoichiometries by the relative SLP-76–prey cellular abundances is shown by a dashed diagonal line that delimits a “forbidden” area (dark gray). Prey dot size is commensurate to its maximal protein enrichment over the course of stimulation.

