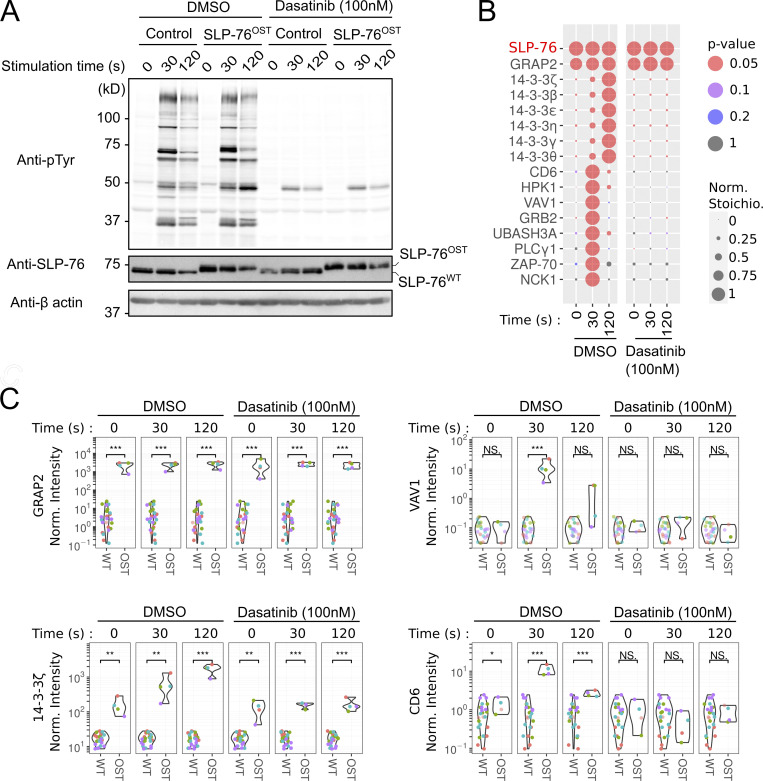
Figure 3.
Comparative analysis of the TCR-triggered SLP-76 interactomes of human primary CD4+ T cells in the presence or absence of dasatinib. (A) Immunoblot analysis of equal amounts of proteins from total lysates of SLP-76OST and control human CD4+ T cells that were expanded for AP-MS and either left unstimulated (0 s) or stimulated for 30 or 120 s with anti-CD3 and anti-CD28 and probed with antibody to phosphorylated tyrosine (anti–p-Tyr), anti–SLP-76, or anti-β actin (loading control). Before stimulation, T cells were incubated for 45 min at 37°C with either dasatinib (100 nM) or vehicle alone (DMSO) as specified. Dasatinib (100 nM) and DMSO were also kept during all the subsequent steps until cell lysis. Data are representative of at least two independent experiments. (B) Dot plot showing the interaction stoichiometry of SLP-76 with its high-confidence TCR regulated preys over the course of TCR-CD28 stimulation and in the presence of dasatinib or vehicle (DMSO). The stoichiometry of the constitutive SLP-76–GRAP2 interaction is also shown. For each SLP-76–prey interaction, the interaction stoichiometry has been row-normalized to its maximum value observed over the course of TCR-CD28 stimulation (see normalized stoichiometry [Norm. Stoichio.] key). Also shown is the P value corresponding to the enrichment in OST-tagged versus untagged AP-MS samples (see P value key). (C) Plot comparing the enrichment (shown as normalized intensity, see Materials and methods) of GRAP2, VAV1, 14-3-3 ζ, and CD6 in AP-MS samples from SLP-76OST (OST) and control (WT) human CD4+ T cells over the course of TCR-CD28 stimulation in the presence of dasatinib or vehicle (DMSO). ***, P < 0.001; **, P < 0.01; *, P < 0.05; NS, P ≥ 0.05, where P corresponds to a Welch’s two-sided t test P value.

