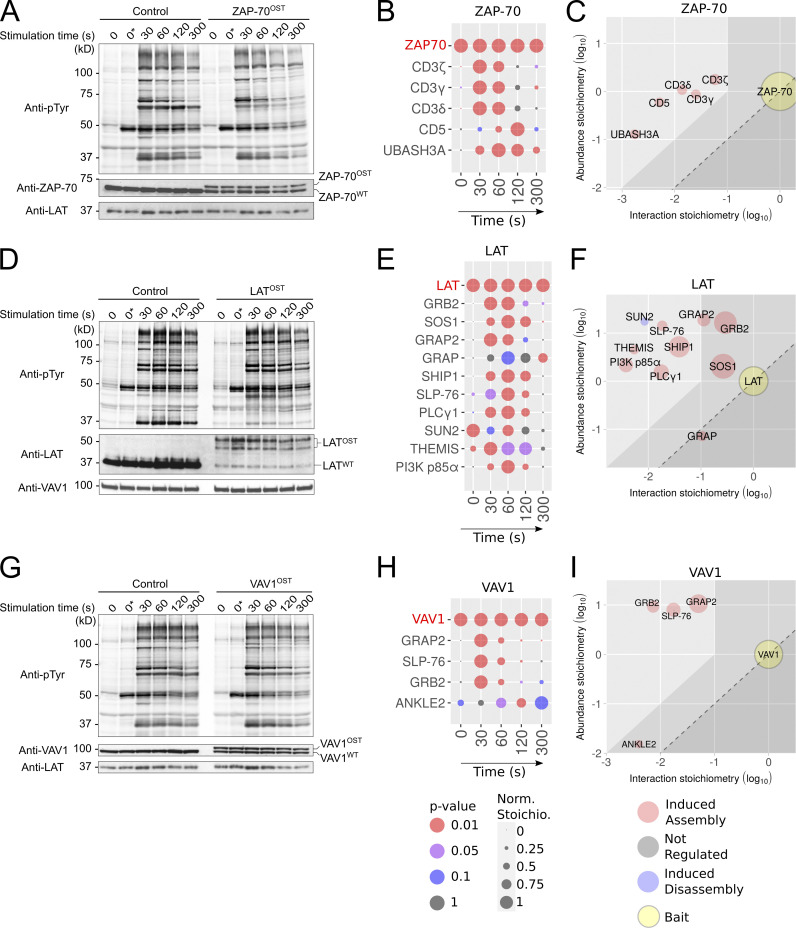
Figure 4.
Composition, dynamics, and stoichiometry of the ZAP-70, LAT, and VAV1 interactomes of human primary CD4+ T cells. (A) Immunoblot analysis of equal amounts of proteins from total lysates of ZAP-70OST–edited and control CD4+ T cells that were expanded for AP-MS and either left unstimulated (0 s) or stimulated for 30, 60, 120, or 300 s with anti-CD3 and anti-CD28 and probed with antibody to phosphorylated tyrosine (anti–p-Tyr), anti–ZAP-70, or anti-LAT (loading control). Note that our traceable genetic edition of primary human T cells ensures that at least one allele of the targeted gene is edited. In the case of the LCP2 gene, the editing process was highly efficient, and the two available LCP2 alleles incorporated the OST tag (Fig. 1 E). In contrast, in the case of the ZAP70, LAT, and VAV1 genes, only one of the two alleles incorporated the OST tag, leaving the other allele in a WT configuration (Fig. 4, A, D, and G). Note that it has no impact on the determination of bait–prey interaction stoichiometry. (B) Dot plot showing the interaction stoichiometry over the course of TCR stimulation of the ZAP-70OST bait with its five high-confidence preys, the interaction stoichiometry of which changed following TCR engagement. For B, E, and H, see description in Fig. 2 C. (C) Stoichiometry plot of the ZAP70OST interactome. For C, F, and I, see description in Fig. 2 D. (D) Immunoblot analysis of equal amounts of proteins from total lysates of LATOST-edited and control CD4+ T cells that were expanded for AP-MS and either left unstimulated (0 s) or stimulated for 30, 60, 120, or 300 s with anti-CD3 and anti-CD28 and probed with antibody to phosphorylated tyrosine (anti–p-Tyr), anti-LAT, or anti-VAV1 (loading control). (E) Dot plot showing the interaction stoichiometry over the course of TCR stimulation of LATOST with its 10 high-confidence preys, the interaction stoichiometry of which changed following TCR engagement. (F) Stoichiometry plot of the LATOST interactome. (G) Immunoblot analysis of equal amounts of proteins from total lysates of expanded VAV1OST-edited and control CD4+ T cells that were either left unstimulated (0 s) or stimulated for 30, 60, 120, or 300 s with anti-CD3 and anti-CD28 and probed with antibody to phosphorylated tyrosine (anti–p-Tyr), anti-VAV1, or anti-LAT (loading control). (H) Dot plot showing the interaction stoichiometry over the course of TCR stimulation of VAV1OST with its four high-confidence preys, the interaction stoichiometry of which changed following TCR engagement. (I) Stoichiometry plot of the VAV1OST interactome. Data in A, D, and G are representative of at least two independent experiments. Left margin in A, D, and G, molecular size in kilodaltons. To avoid cropping the immunoblots shown in A, D, and G, we kept an additional condition denoted t = 0 * s, in which T cells were incubated for 15 min on ice with anti-CD3 and anti-CD28 antibodies and incubated at 37°C for 5 min before lysis. In contrast, in the “regular” t = 0 s condition, T cells were incubated without anti-CD3 and anti-CD28 antibodies for 15 min on ice and incubated at 37°C for 5 min before lysis. Both conditions resulted in a similar pattern of tyrosine phosphorylated proteins.

