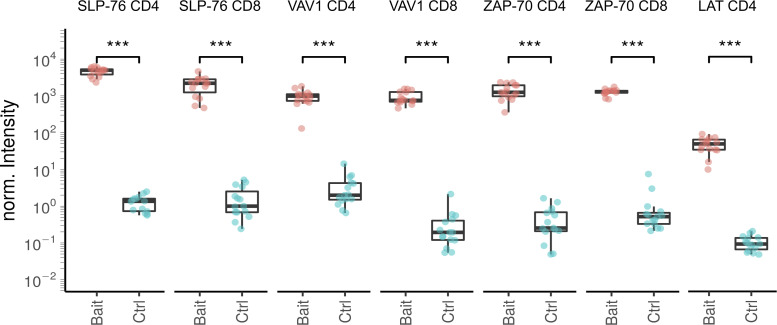
Figure S2.
Plot showing the reproducibility of the affinity purification and the enrichment of the bait protein. Samples (Bait) correspond to LATOST-edited CD4+ T cells, SLP-76OST–edited CD4+ and CD8+ T cells, VAV1OST-edited CD4+ and CD8+ T cells, and ZAP-70OST–edited CD4+ and CD8+ T cells as compared with the corresponding control samples (Ctrl). Protein intensities were normalized (norm.) according to the sample median intensity and averaged across technical replicates (see Materials and methods). Boxplot elements: Center line corresponds to median, box limits correspond to the first and third quartiles (Q1 and Q3), and whiskers indicate variability from Q1 − 1.5 × IQR to Q3 + 1.5 × IQR; IQR = Q3 − Q1, where IQR stands for interquartile range. Statistical significance was calculated using two-sided unpaired Welch’s t/Student’s t tests (***, P ≤ 0.001).

