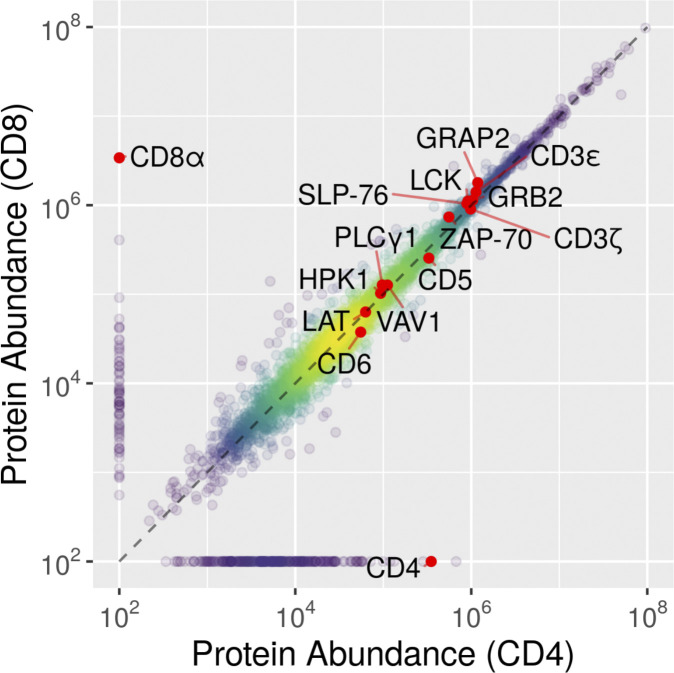
Figure S4.
Comparison of the cellular abundance of the proteins quantified in CD4+ and CD8+ primary human T cells. Using the “proteomic ruler” method (Wiśniewski et al., 2014), we were able to quantify protein abundance for 5,151 and 4,905 protein groups in expanded CD4+ and CD8+ primary human T cells, respectively. 8.6% of the quantified proteins were expressed only in CD4+ or CD8+ T cells. A few proteins relevant for the present study are highlighted.

