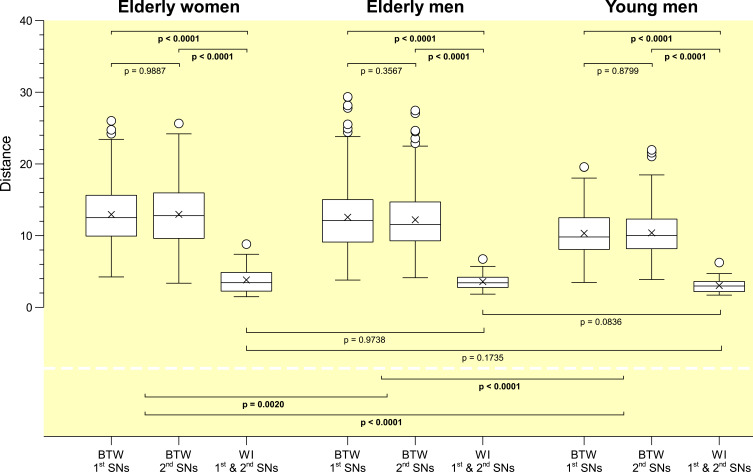
Figure 4.
Comparisons of inter- and intraindividual Manhattan distances computed between the first and second sham nights for all three samples. For each sample, first and second box plots represent the distribution of between-subject (BTW) distances for the first and second sham nights (elderly women: n=406; elderly and young men: n=351), respectively, whereas the third box plot shows the distribution of within-subject (WI) distances between first and second sham nights (elderly women: n=29; elderly and young men: n=27). Proximity measures were performed for NREM sleep EEG signals recorded at C3.

