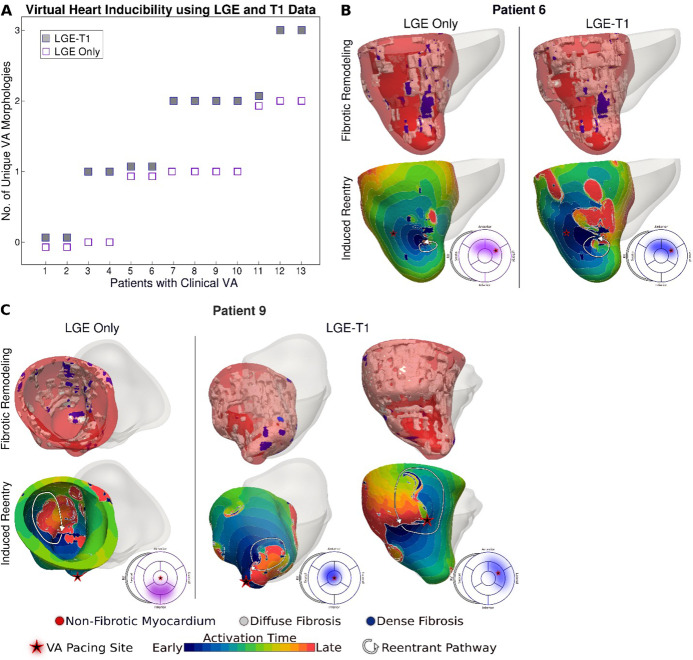
Figure 5. Comparison of arrhythmogenesis in hypertrophic cardiomyopathy (HCM) models of patients with clinical ventricular arrhythmias (VAs).
(A) Plot of the number of unique VA morphologies for patients with clinical VA using late gadolinium enhancement (LGE)-T1 and LGE-only models. (B, C) Comparison of VAs in corresponding LGE-T1 and LGE-only models. Pacing site(s) are marked with stars. Bullseye plots show the pacing site location (star) and the location of the reentrant pathway in LGE-T1 (blue) and LGE-only (purple) models.

