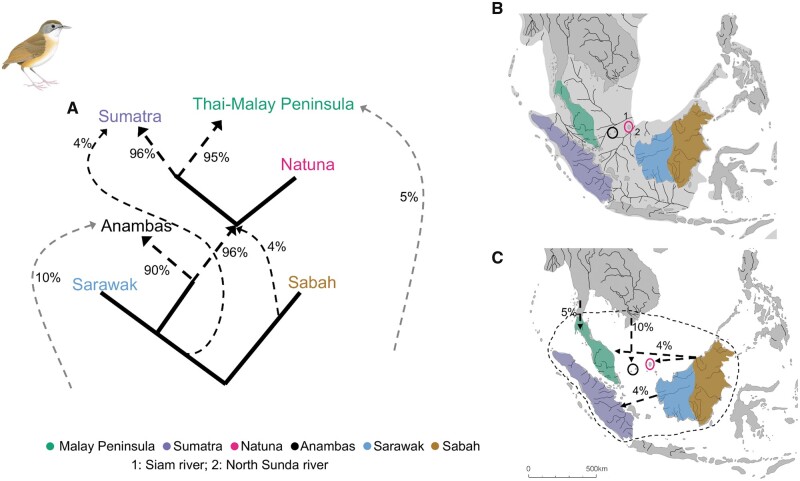
Fig. 5.
Admixture graph of gene flow dynamics observed in Pellorneum malaccense. (A) Schematic of genetic ancestry and admixture proportions among populations of P. malaccense based on single best-fit admixture graph; (B) map during sea level recession of approximately 120 m at glacial maximum around 20,000 years before present, showing major paleo-rivers and present-day taxon distributions; (C) current map of South East Asia with taxon distributions, major rivers, and arrows indicating potential gene flow among populations or from unsampled or extinct populations (see A). The black-stippled line indicates potential habitat during sea level lows. Panels (B) and (C) modified with permission from Voris (2000).

