. 2021 Dec 13;10:e70812. doi: 10.7554/eLife.70812

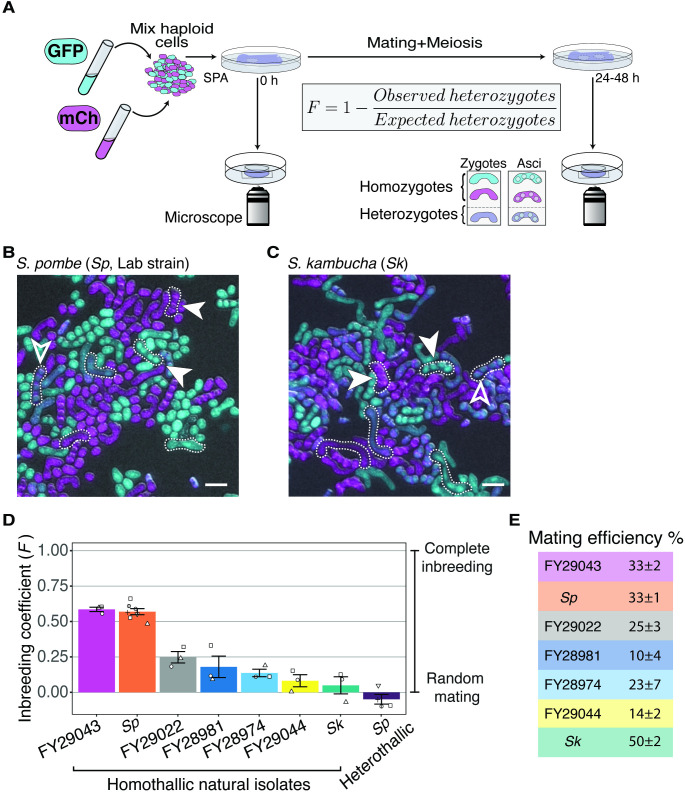
Figure 1. Inbreeding coefficients vary between homothallic isolates of Schizosaccharomyces pombe.

(A) Experimental strategy to quantify mating patterns between mixed homothallic isolates. GFP (cyan)- and mCherry (magenta)-expressing cells were mixed and placed on SPA medium that induces mating and meiosis. An agar punch from this plate was imaged to assess the initial frequencies of each haploid strain. After incubation at 25°C for at least 24 hr, another punch was imaged to determine the number of homozygous and heterozygous zygotes/asci based on their fluorescence. The inbreeding coefficient (F) was calculated using the formula shown. (B and C) Representative images of the mating in Sp (B) and Sk (C) isolates after 24 hr. Filled arrowheads highlight examples of homozygous asci whereas open arrowheads highlight heterozygous asci. A few additional zygotes are also outlined with dotted lines in the images. Scale bars represent 10 µm. (D) Inbreeding coefficient of homothallic natural isolates and complementary heterothallic (h+,h- mCherry and h+,h- GFP) Sp lab strains. At least three biological replicates per isolate are shown (open shapes). (E) Mating efficiency of the isolates shown in (D) (%) ± standard error from three biological replicates of each natural isolate.

Figure 1—source data 1. Schizosaccharomyces pombe natural isolates.
List of S. pombe natural isolates reported by Tusso et al., 2019. Those selected to measure inbreeding coefficients using microscopy are highlighted and observations for these from other studies are reported (Jeffares et al., 2015; Nieuwenhuis et al., 2018).

Figure 1.

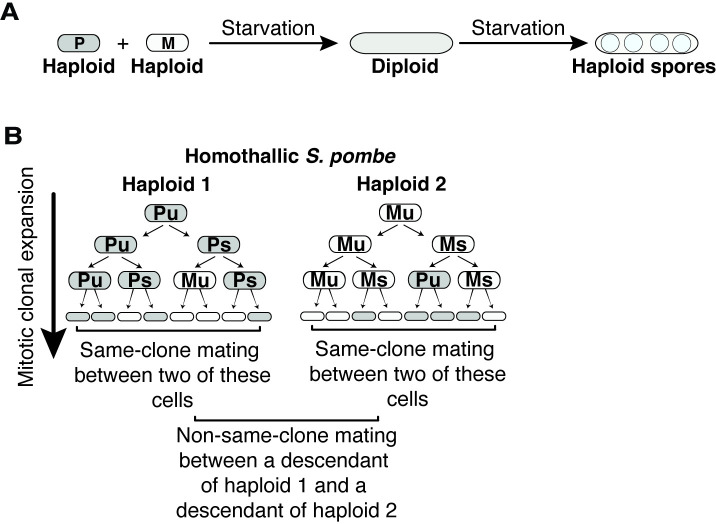
Figure 1—figure supplement 1. Sexual cycle of Schizosaccharomyces pombe.

Figure 1—figure supplement 1.

(A) S. pombe haploid cells of compatible mating types h+ (P) and h- (M) can be induced to mate upon nitrogen starvation to form a diploid zygote. If starvation continues, the zygote undergoes meiosis to form haploid spores. (B) Patterns of mating-type switching in clonally expanding Sp cells. An unswitchable cell (u) divides to produce a switchable cell (s) and an unswitchable cell. Switchable cells divide to produce another switchable cell of the same mating type and an unswitchable cell of the opposite mating type. Cells that switch mating type (P to M or M to P) during mitotic growth are compatible within the clonal populations. Mating between cells derived from the same haploid progenitor are considered same-clone mating in this study. Mating events between descendants from different founder haploid cells are considered non-same-clone mating.
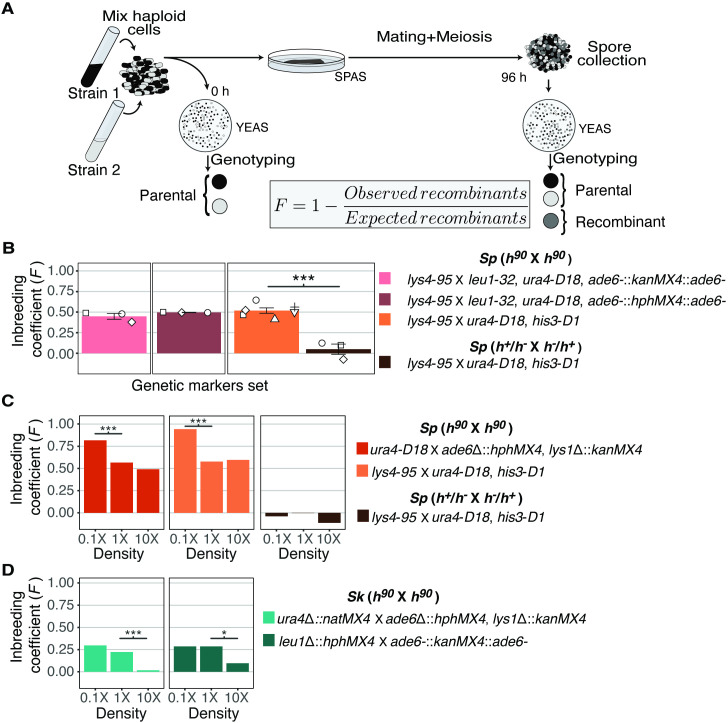
Figure 1—figure supplement 2. Inbreeding coefficients can be affected by cell density.

Figure 1—figure supplement 2.

(A) Experimental strategy to infer inbreeding coefficient by genotyping the segregation of unlinked genetic markers. The composition of the starting population was measured by genotyping cells placed on rich medium (YEAS). Cells were also plated on SPAS, where they mate and undergo meiosis. After meiosis, spores were genotyped and we compared the expected number of recombinant progeny to the number observed to calculate the inbreeding coefficient (F). (B) Inbreeding coefficients calculated as described in (A) using the indicated genetic markers at standard 1× mating density. Each color indicates a different cross. *** indicates p-value < 0.005, One-tailed t-test on at least three biological replicates (open shapes). (C) Inbreeding coefficients calculated as described in (A) for Sp crosses plated at low (0.1×), standard (1×), and high (10×) density. *** indicates p-value < 0.005, G-test. Colonies were randomly sampled for each cross, 320 for left panel and 144 colonies for the second and third cross sets. (D) Inbreeding coefficients calculated as described in (A) for Sk crosses plated at low (0.1×), standard (1×), and high (10×) density. *** indicates p-value < 0.005, * indicates p-value < 0.05, G-test; 325 and 340 colonies were sampled from the crosses in the left and right panels, respectively.
Figure 1—figure supplement 2—source data 1. Raw data of allele transmission values reported in Figure 1—figure supplement 2.
Crosses shown in Figure 1—figure supplement 2 were genotyped before and after meiosis. The absolute and relative frequencies of each genotype were quantified. Segregation for each genetic marker is reported. From each cross, the list of recombinant genotypes are described. In Tables 1–3 on spreadsheet 1 (columns B–K) we show the genotypes, number of colonies counted, and initial frequencies of the two parents used in each cross represented in Figure 1—figure supplement 2B. In columns L, O, and R we show the expected frequency of Parent1, Parent2, and recombinants, respectively, predicted using Hardy-Weinberg. Columns M–Y show the results obtained after meiosis. In columns M–N, P–Q, and S–T we report the observed frequency and total number of colonies counted for Parent1, Parent2, and recombinants, respectively. In columns U–W (U–X for Table 3) we report the transmission frequency of each individual marker in the recombinants. The inbreeding coefficient for each cross is reported in column Y. In Tables 4–6 we show the numbers of each genotype obtained after meiosis for each replicate experiment. Parental genotypes are shown in white. Discordant genotypes are highlighted in blue at the bottom of each table. We also specify which experiments were performed manually and which were performed using robotics. Spreadsheet 2 shows similar data for the multiple density experiments shown in Figure 1—figure supplement 2C-D. Column Q also shows the G of fit G-test p-value.
Figure 1—figure supplement 3. Homothallism of natural isolates.
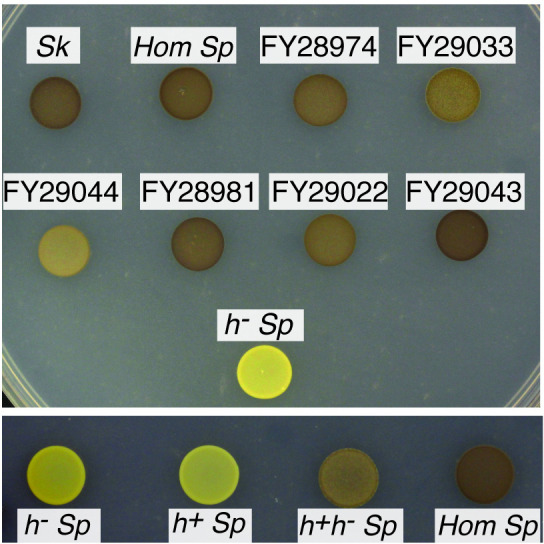
Figure 1—figure supplement 3.

Saturated cultures were spotted on SPAS to induce mating and meiosis. After 5 days at 25°C, cells were exposed to iodine vapor, which stains spores brown. The top panel shows natural isolates of homothallic (Hom) strains and h- Sp as a negative control. The bottom panel shows individual heterothallic strains, mixed complimentary heterothallic strains, and a homothallic isolate of Sp.
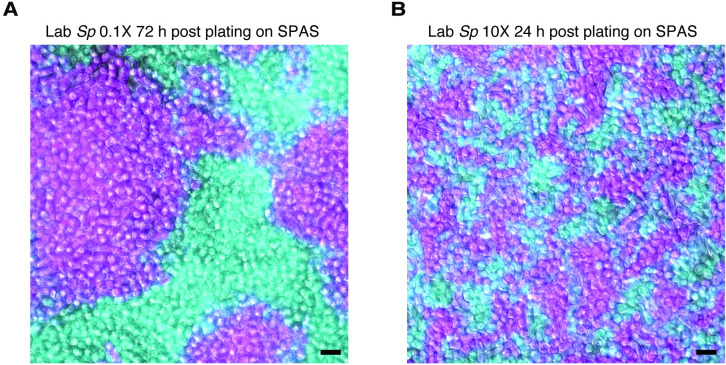
Figure 1—figure supplement 4. Density variation in plated cells.

Figure 1—figure supplement 4.

Homothallic GFP (cyan)- and mCherry (magenta)-expressing cells were mixed, plated on SPAS, incubated at 25°C, and then imaged. On this medium, cells tend to divide until confluent prior to mating. When plated at low density (0.1×; A), cells form large clusters of clonal cells after ~72 hr. Cells mixed and plated at high density (10×; B) reach confluency after just 24 hr and form clusters with more contact zones between cells of different genotypes. Scale bars represent 10 µm.