. 2021 Dec 13;10:e70812. doi: 10.7554/eLife.70812

Figure 4. Inbreeding slows the spread of the wtf4 meiotic driver in homothallic strains.

(A) Experimental strategy to monitor allele frequency through multiple generations of sexual reproduction. GFP (green) and mCherry (magenta) markers are used to follow empty vector (EV) alleles or the wtf4 meiotic driver. Starting allele frequencies and allele frequencies after each round of sexual reproduction were monitored using cytometry. (B) Homothallic population with mCherry marking wtf4 and GFP marking an EV allele. Allele dynamics were predicted using drive and fitness parameters described in the text assuming an inbreeding coefficient of 0.5 (black lines) and random mating (inbreeding coefficient of 0; gray lines). The individual spots represent biological replicates and the shaded areas around the lines represent 95% confidence intervals. (C) Same experimental setup as in (B), but with mCherry marking the EV allele and GFP marking wtf4. (D–E) Repeats of the experiments shown in (B) and (C) with two alterations. First, these experiments tracked heterothallic populations (dotted lines) in addition to homothallic cells (solid lines). Second, the populations were sorted by cytometry at generations 3 and 5 (vertical long-dashed lines) to remove non-fluorescent cells.

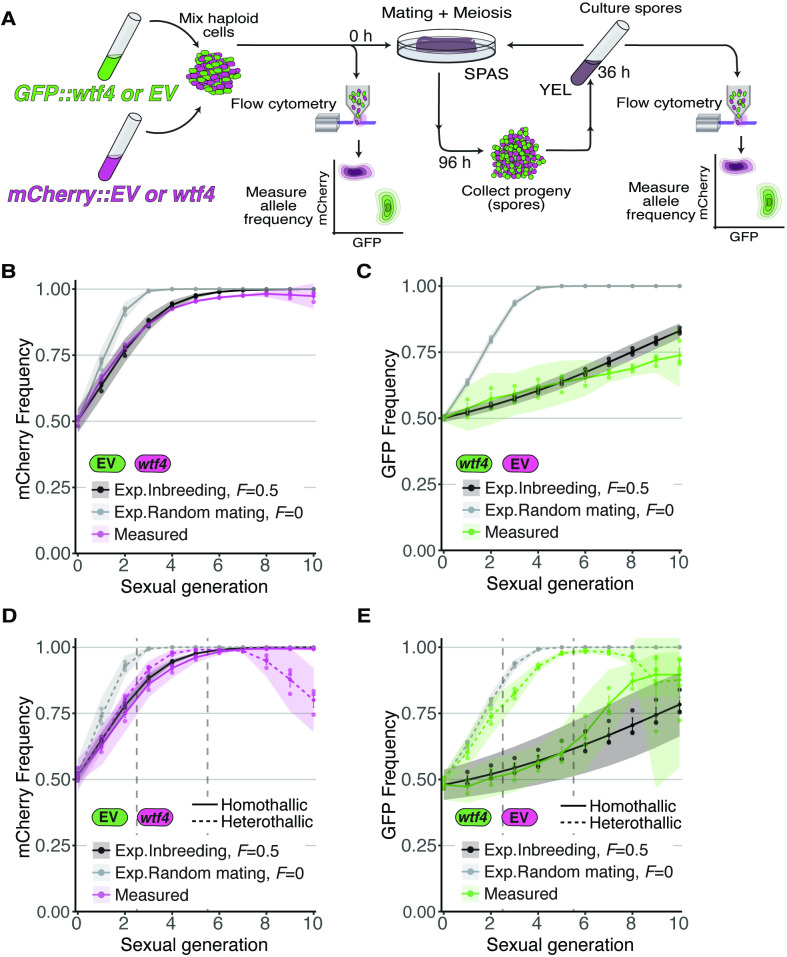
Figure 4.

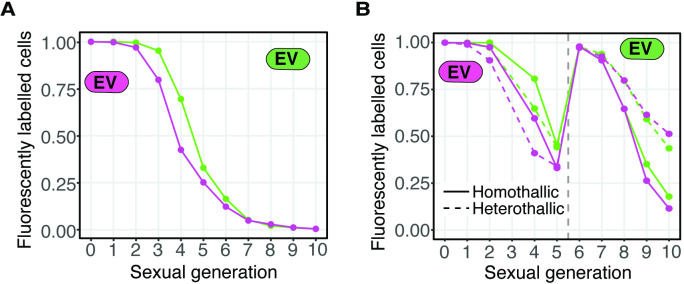
Figure 4—figure supplement 1. Loss of fluorescent markers in experimental evolution analyses.

Figure 4—figure supplement 1.

(A) Fluorescent marker loss from cell populations carrying only one type of fluorescent marker (GFP or mCherry) linked to an empty vector (EV). Cells were grown as in Figure 4A in parallel to the cell populations depicted in Figure 4B–C. (B) Similar to A, but both heterothallic and homothallic cells were analyzed in parallel to the cell populations depicted in Figure 4D–E. The cells were sorted after generation five to remove non-fluorescent cells (vertical gray dotted line).
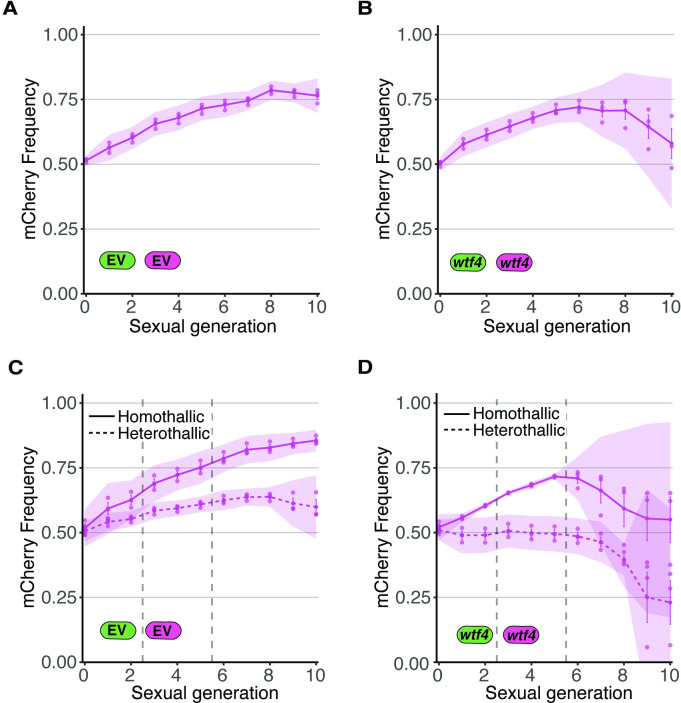
Figure 4—figure supplement 2. Allele transmission in homozygous control homothallic and heterothallic populations.

Figure 4—figure supplement 2.

(A) Homothallic population with both mCherry and GFP marking empty vector (EV) alleles. The individual spots represent biological replicates and the shaded areas around the lines represent 95% confidence intervals. (B) Same experimental setup as in (A), but with both markers linked to a wtf4 allele. (C–D) Repeats of the experiments shown in (A) and (B) with two alterations. First, these experiments tracked heterothallic populations (dotted lines) in addition to homothallic cells (solid lines). Second, the populations were sorted by cytometry at generations 3 and 5 (vertical long-dashed lines) to remove non-fluorescent cells.