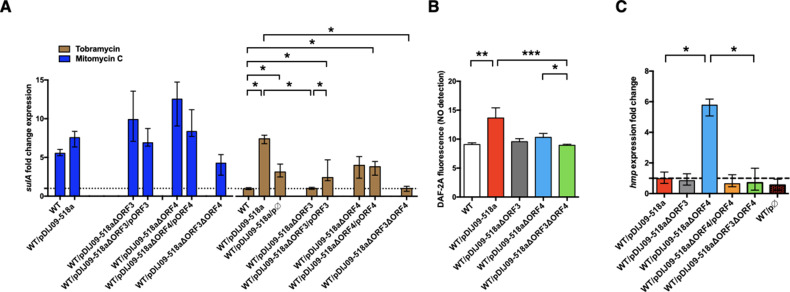
Figure 5. Deletion of ORF3 decreases the SOS response induction, after tobramycin treatment and ORF4 regulates the Hmp nitric oxide detoxification pathway.
(A) Relative expression of sulA in E. coli MG1656 (WT) derived isogenic strains carrying pDIJ09-518a with ORF3 and/or ORF4 deleted and complemented, exposed to mitomycin C (dark blue) or tobramycin (brown) in comparison to expression in lysogeny broth (LB), normalized with dxs. Data represent median values of six independent biological replicates, and error bars indicate upper/lower values. *p < 0.05. Wilcoxon matched-pairs signed-rank test. (B) Nitric oxide (NO) formation for the isogenic strains (n = 6). Data were analysed using a Kruskal–Wallis test, with a p value <0.0001 for the overall analysis of variance (ANOVA). NO formation for each strain was analysed using Dunn’s multiple comparisons test. *p < 0.05, **p < 0.01, and ***p < 0.001. Bars represent mean values and SD. (C) Relative expression of hmp in E. coli MG1656 (WT) derivative isogenic strains carrying pDIJ09-518a with ORF3 and/or ORF4 deleted and complemented, or the empty vector, grown in LB, in comparison to expression in E. coli MG1656 (WT), normalized with dxs. Data represent median values of six independent biological replicates, and error bars indicate upper/lower values. Wilcoxon matched-pairs signed-rank test. *p < 0.05.


