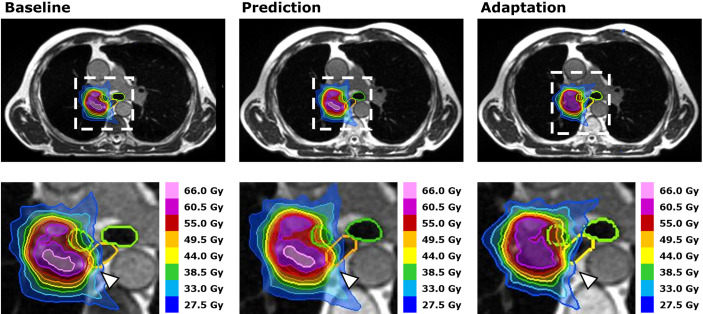
Figure 4.
Case Study. Dose distributions for dose intensified SBRT (10 × 5.5 Gy) of an ultracentral lung tumor adjacent to the right main stem bronchus at baseline (left), after plan prediction (middle) and after plan adaptation (right). Segmentations of the proximal bronchial tree (green) and the esophagus (orange) demonstrate a shift of the esophagus into the high dose volume after plan prediction. This led to a violation of the esophageal dose constraint, which was remedied successfully by plan adaptation (white arrowheads).

