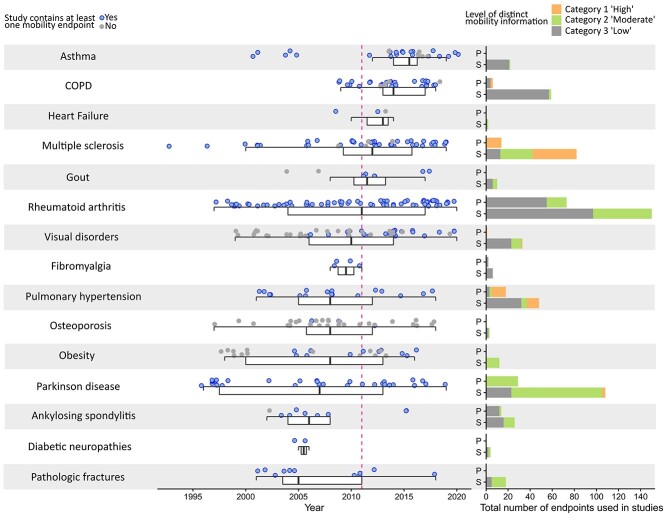
Figure 4.
Key time points for included studies, EPARs and scientific publications. Left column: Publication date of first efficacy results of clinical studies. Studies that report on mobility are coloured blue. Boxplots show the median as thick bar, the lower and upper hinges of the box correspond to the 25th and 75th percentiles, whiskers extend to 1.5×inter-quartile range. For 20 studies (Osteoporosis n = 4, Visual disorders n = 10, Parkinson disease n = 2, Rheumatoid arthritis n = 2, Multiple sclerosis n = 1 and Pulmonary hypertension n = 1) dates on study start/stop were not available. Right column: Specific information on mobility disability deducible from primary (p) and secondary (s) mobility endpoints. All mobility endpoints were categorised into three tiers. Category 1: High level of distinct mobility information. Category 2: Moderate level of distinct mobility information. Category 3: Low level of distinct mobility information. For the complete definition of categories, please see Methods section.

