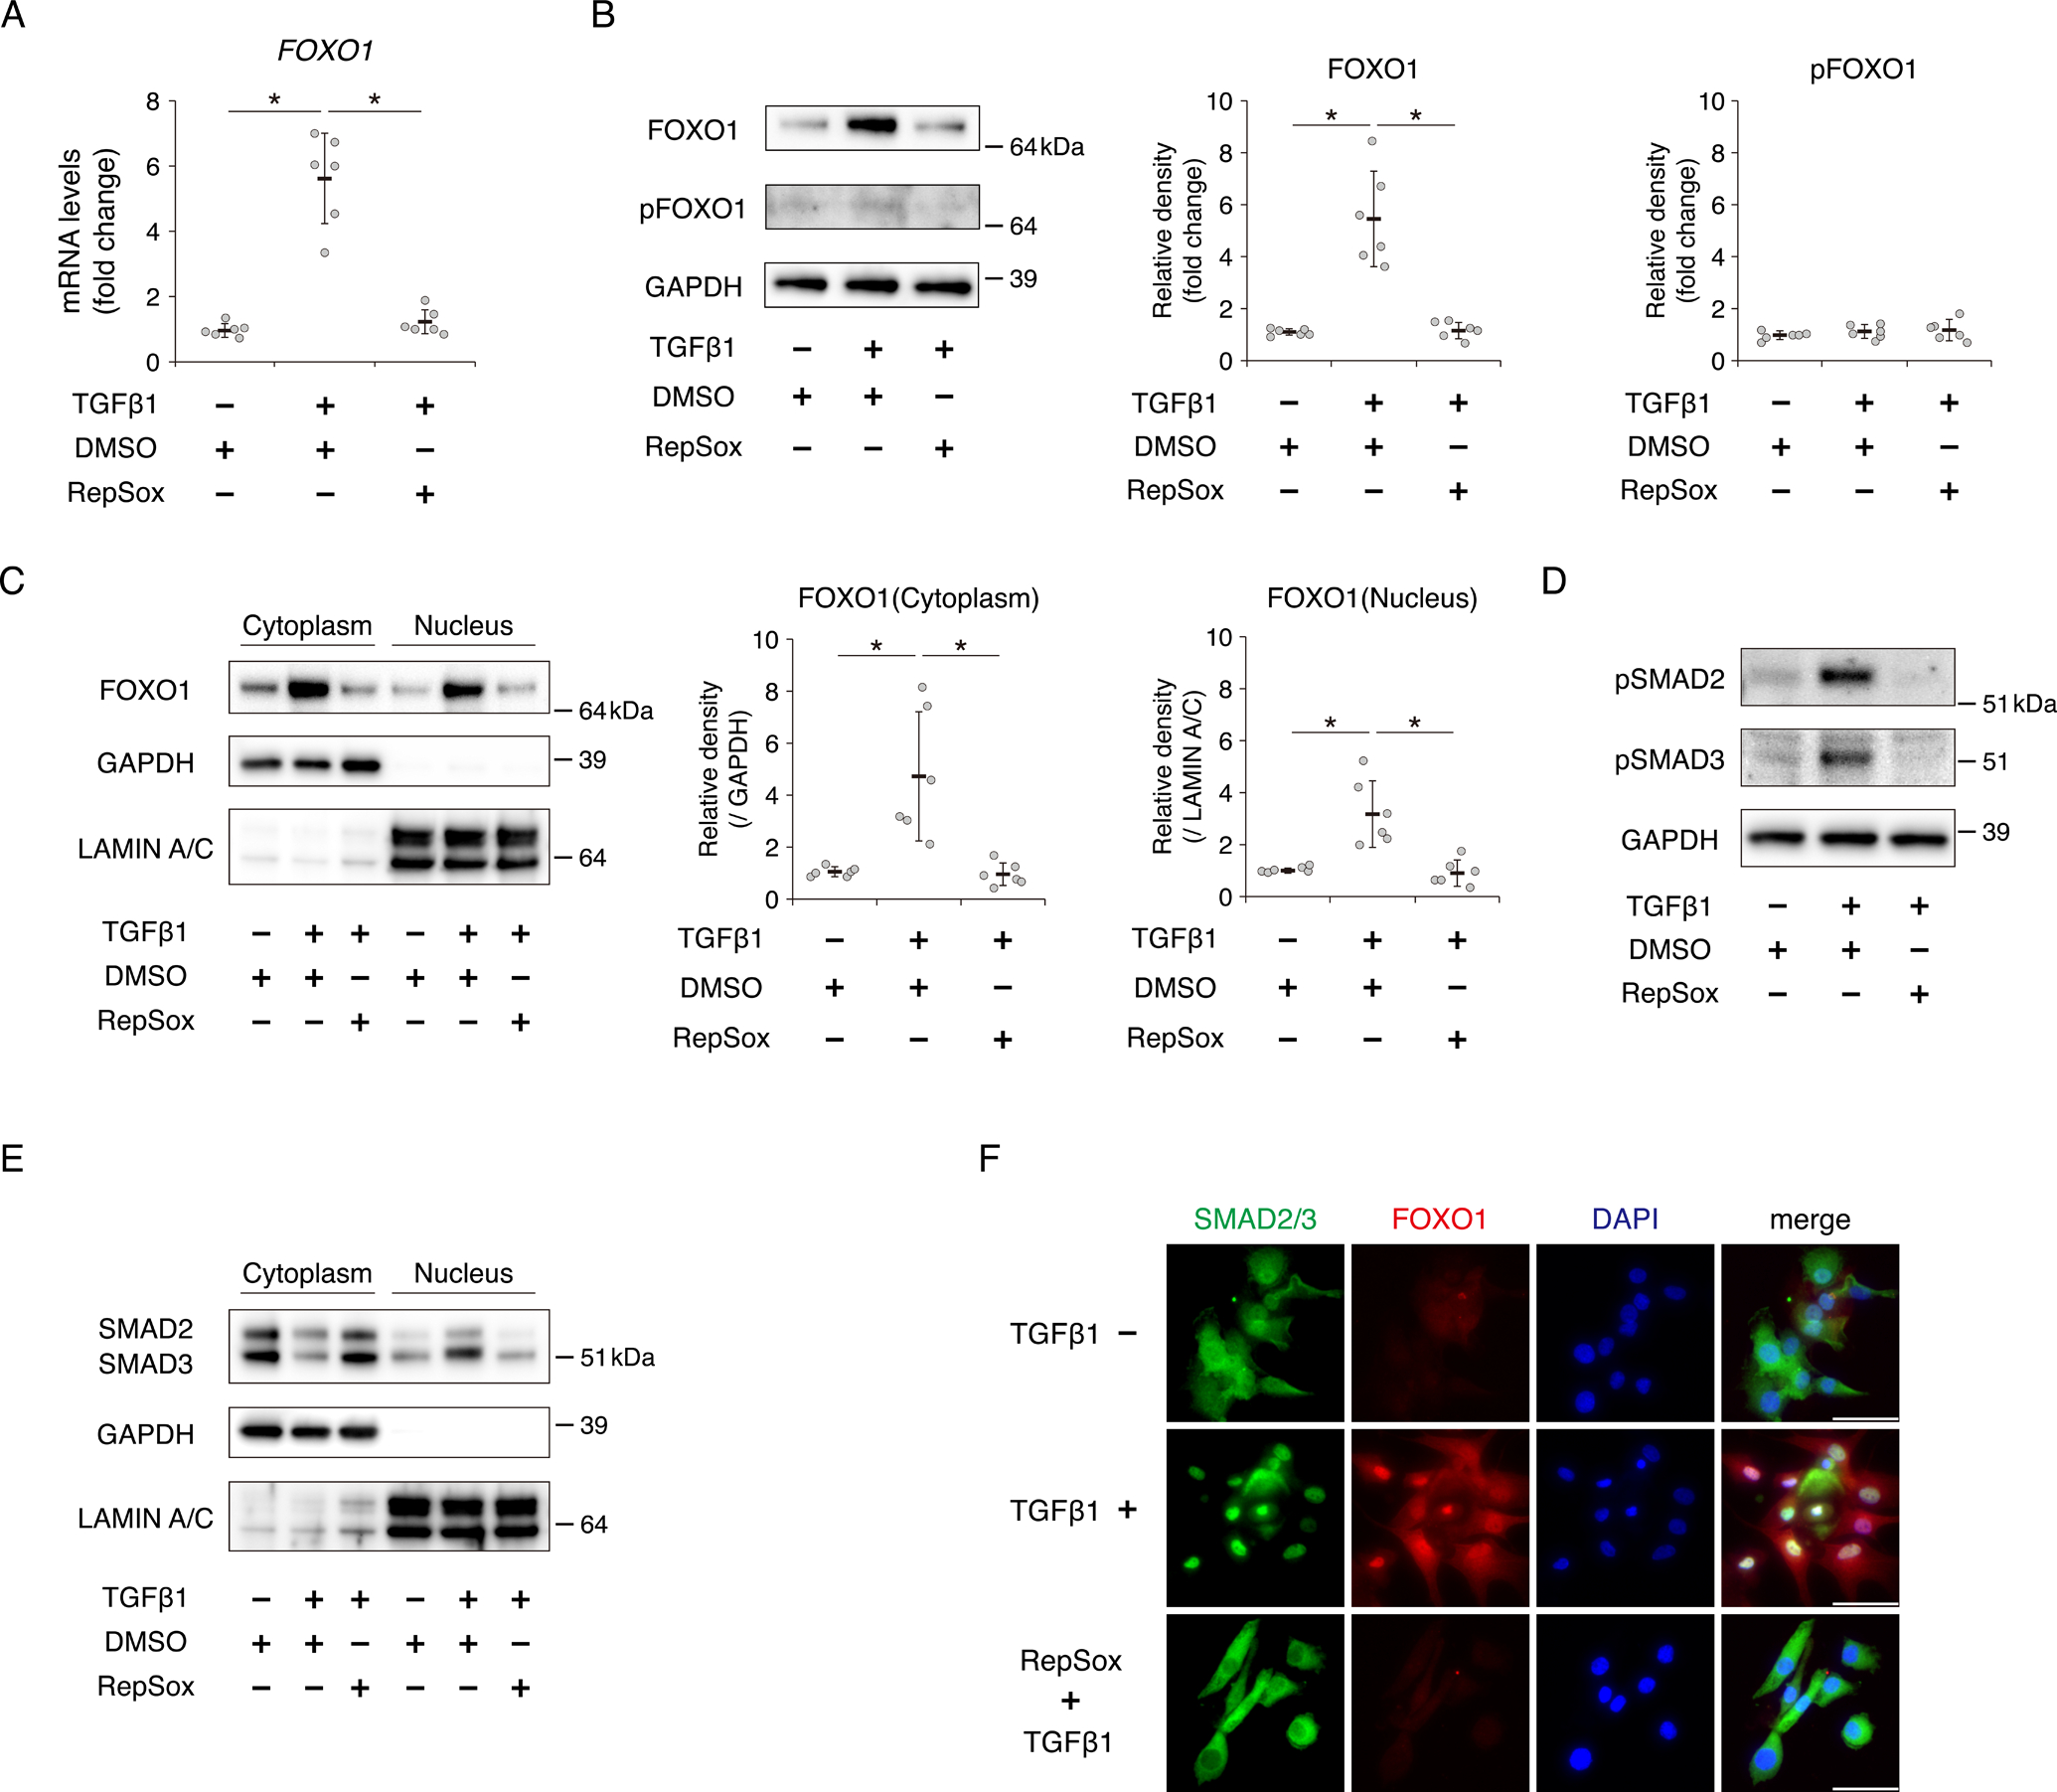
Fig. 3. ALK5 inhibition suppresses induction of FOXO1 expression by TGFβ1 in human chondrocytes.

Chondrocytes were incubated with or without TGFβ1 (10 ng/ml) for 24 hours after pretreatment with or without RepSox (1 μM) for 3 hours. (A) Relative mRNA levels of FOXO1 were measured by qRT-PCR. Gene expression at each stage is expressed relative to the level in cells incubated without TGFβ1 and RepSox; n = 6 independent experiments. (B) Levels of total FOXO1 and pFOXO1 were analyzed by western blotting. GAPDH was used as a loading control. Graphs show total FOXO1 protein level and pFOXO1 protein level, relative to the corresponding levels in cells incubated without TGFβ1 and RepSox; n = 6 independent experiments. (C) Levels of cytoplasmic FOXO1 and nuclear FOXO1 were analyzed by western blotting. GAPDH was used as a loading control for cytoplasmic extracts. LAMIN A/C was used as a loading control for nuclear extracts. Graphs show cytoplasmic FOXO1 protein level and nuclear FOXO1 protein level, relative to the corresponding levels in cells incubated without TGFβ1 and RepSox; n = 6 independent experiments. (D) Levels of phosphorylated SMAD2 (pSMAD2) at Ser-465/467 and phosphorylated SMAD3 (pSMAD3) at Ser-423/425 in chondrocytes incubated with or without TGFβ1 (10 ng/ml) for 30 min after pretreatment with or without RepSox (1 μM) for 3 hours, as determined by western blotting. (E) Levels of cytoplasmic SMAD2/3 and nuclear SMAD2/3 in chondrocytes incubated with or without TGFβ1 (10 ng/ml) for 30 min after pretreatment with or without RepSox (1 μM) for 3 hours, as determined by western blotting. (F) SMAD2/3 and FOXO1 localizations in chondrocytes incubated with or without TGFβ1 (10 ng/ml) for 24 hours after pretreatment with or without RepSox (1 μM) for 3 hours were visualized by immunocytochemistry. SMAD2/3 is shown in green, and FOXO1 is shown in red. Nuclei were detected with DAPI (blue staining). Bars, 50 μm. Data are presented as dots showing individual values and as means ± S.D. Statistical analysis was performed using one-way repeated measures ANOVA with the Tukey–Kramer post hoc test. *P < 0.05.
