
Fig. 5. TGFβ1 promotes autophagic activity under oxidative stress through the SMAD3–FOXO1 pathway.
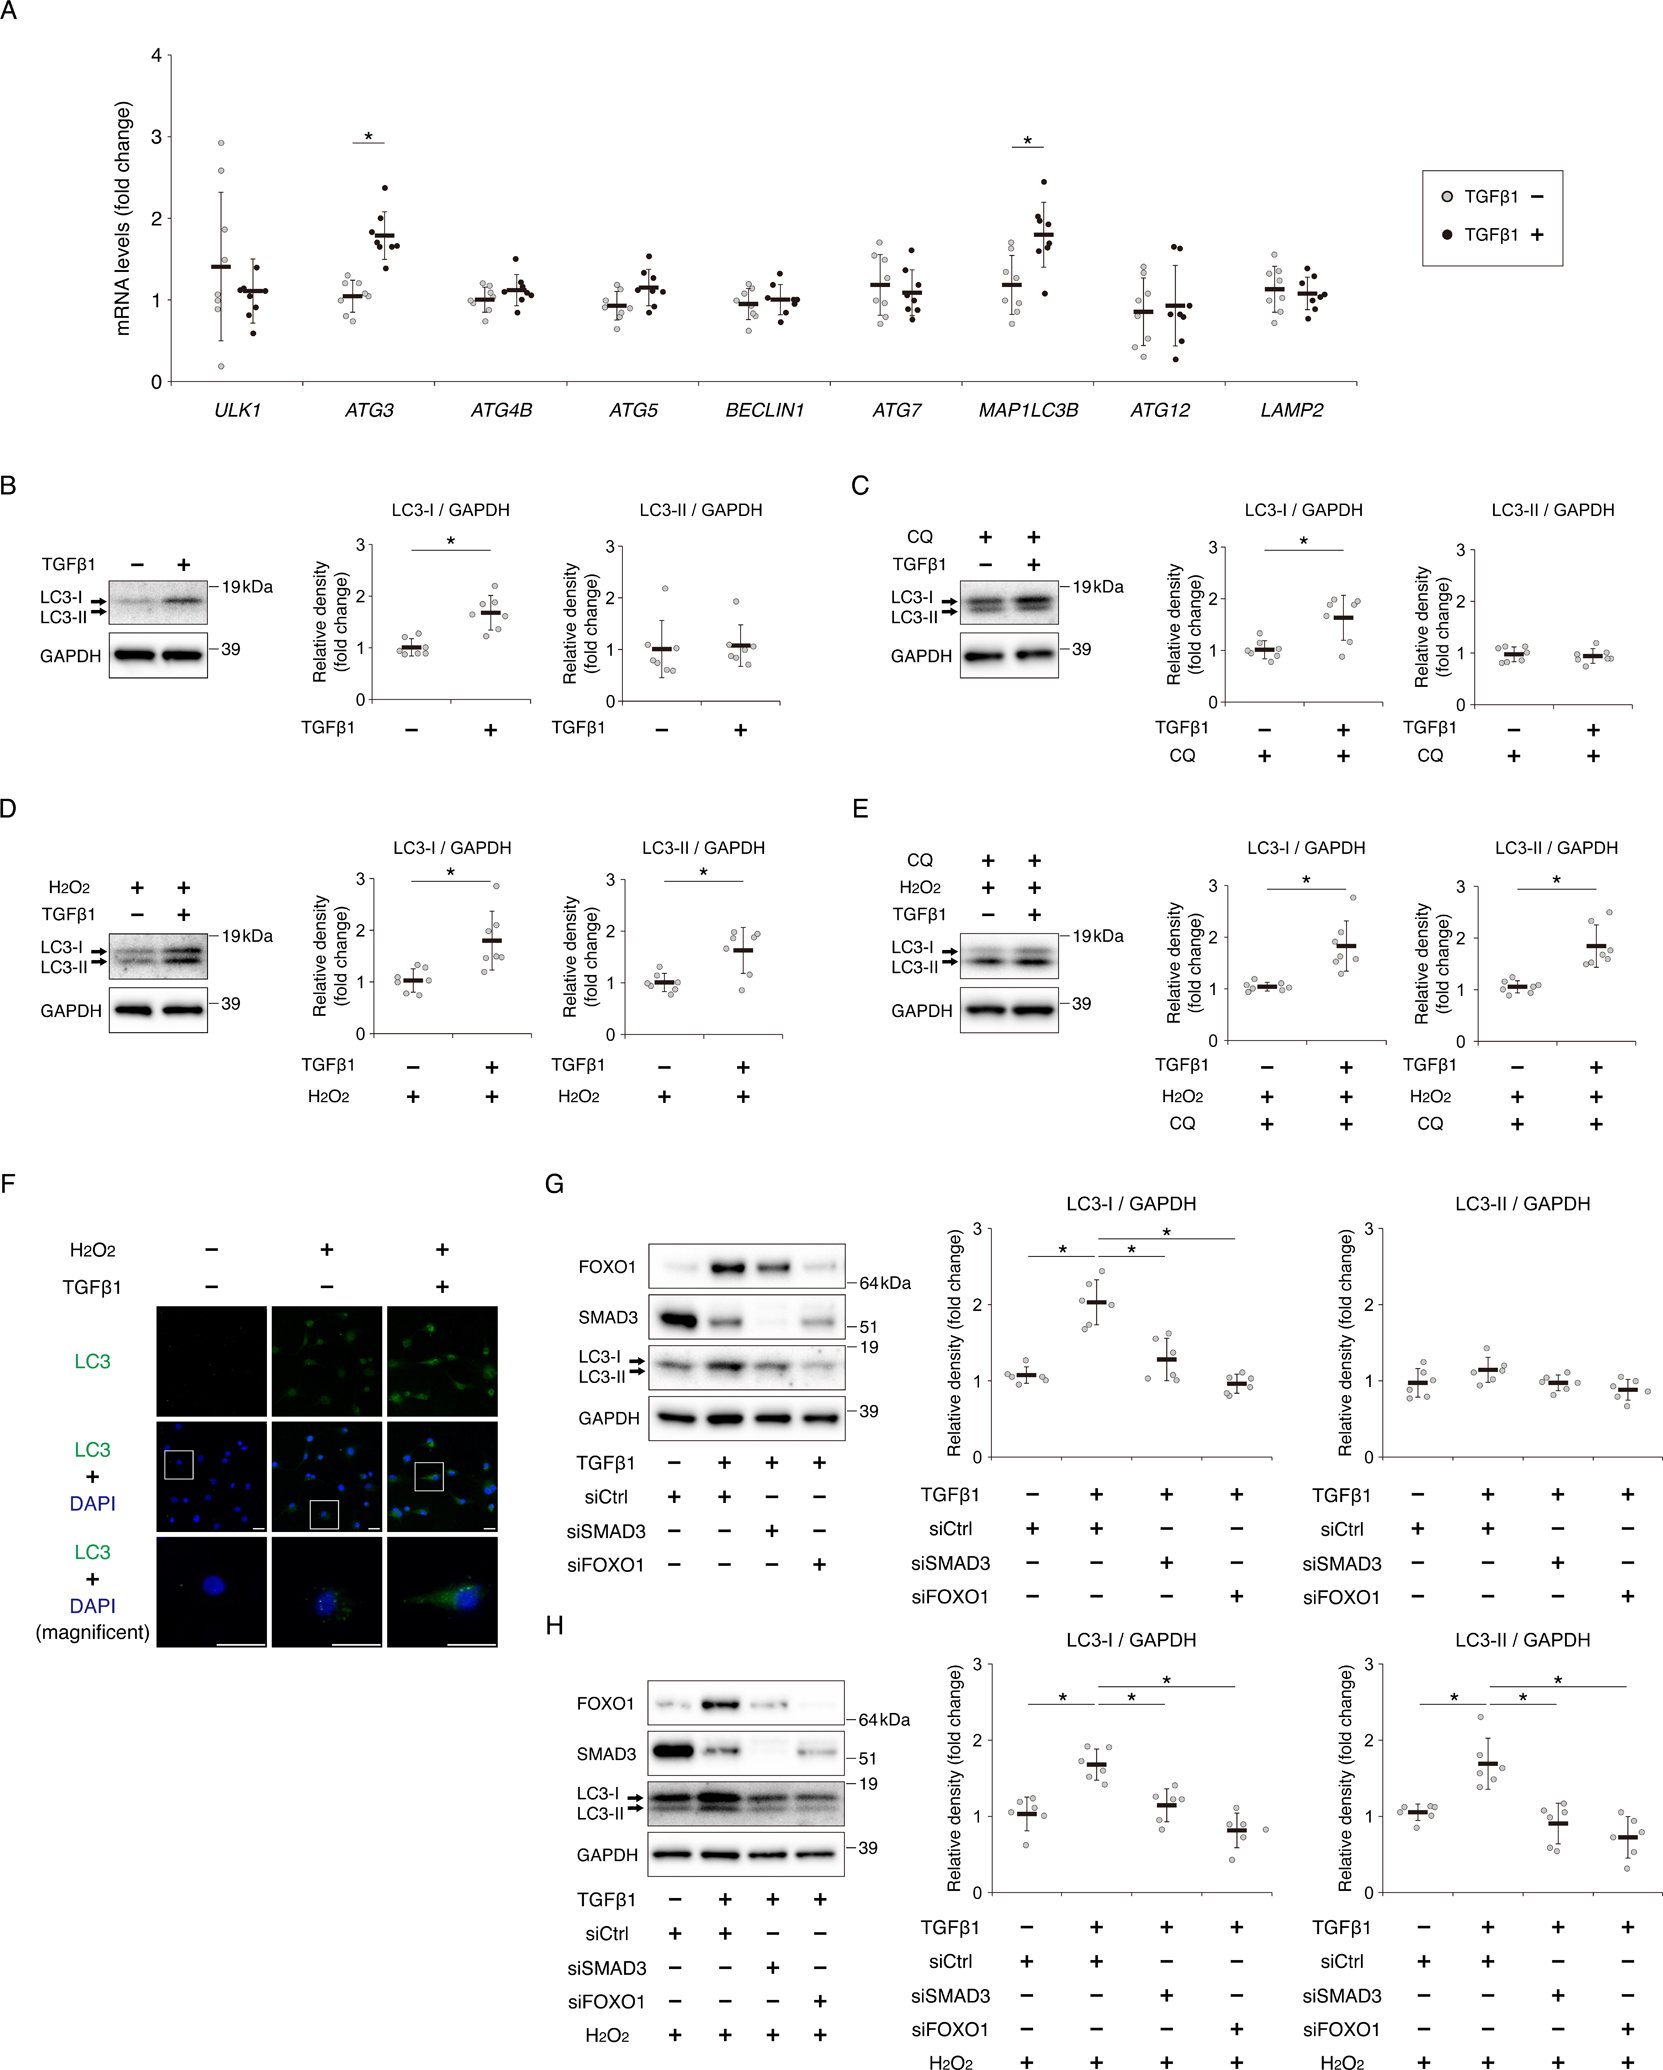
(A) Relative mRNA levels of ULK1, ATG3, ATG4B, ATG5, BECLIN1, ATG7, MAP1LC3B, ATG12, and LAMP2 in human chondrocytes after incubation with TGFβ1 (10 ng/ml) for 24 hours, as determined by qRT-PCR. Gene expression is shown relative to the level in cells incubated without TGFβ1; n = 8 independent experiments. (B) Levels of LC3-I and LC3-II after incubation with TGFβ1 (10 ng/ml) for 24 hours, as determined by western blotting. GAPDH was used as a loading control. Graphs show levels of LC3-I and LC3-II, relative to the corresponding levels in cells incubated without TGFβ1; n = 7 independent experiments. (C) Levels of LC3-I and LC3-II in chondrocytes incubated with chloroquine (CQ) (25 μM) for 2 hours after pretreatment with or without TGFβ1(10 ng/ml) for 22 hours, as determined by western blotting. Graphs show levels of LC3-I and LC3-II, relative to the corresponding levels in cells incubated without TGFβ1; n = 7 independent experiments. (D) Levels of LC3-I and LC3-II in chondrocytes exposed to H2O2 (500 μM) for 2 hours after pretreatment with or without TGFβ1(10 ng/ml) for 22 hours, as determined by western blotting. Graphs show levels of LC3-I and LC3-II, relative to the corresponding levels in cells pretreated without TGFβ1; n = 7 independent experiments. (E) Levels of LC3-I and LC3-II in chondrocytes incubated with CQ (25 μM) and H2O2 (500 μM) for 2 hours after pretreatment with or without TGFβ1(10 ng/ml) for 22 hours, as determined by western blotting. Graphs show levels of LC3-I and LC3-II, relative to the corresponding levels in cells incubated without TGFβ1; n = 7 independent experiments. (F) LC3 proteins in chondrocytes incubated with or without H2O2 (500 μM) for 2 hours after pretreatment with or without TGFβ1 (10 ng/ml) for 22 hours were visualized by immunocytochemistry. LC3 is shown as green dots. Nuclei were detected with DAPI (blue staining). Bottom images show higher-magnification views corresponding to the boxed areas in the middle images. Bars, 30 μm. (G) Levels of FOXO1, SMAD3, LC3-I, and LC3-II, as determined by western blotting, in chondrocytes transfected with siCtrl, siSMAD3, or siFOXO1 after incubation with or without TGFβ1 (10 ng/ml) for 24 hours. Graphs show total levels of LC3-I and LC3-II, relative to the corresponding levels in cells transfected with siCtrl and incubated without TGFβ1; n = 6 independent experiments. (H) Levels of FOXO1, SMAD3, LC3-I, and LC3-II, as determined by western blotting, in chondrocytes transfected with siCtrl, siSMAD3, or siFOXO1 following exposure to H2O2 (500 μM) for 2 hours after pretreatment with or without TGFβ1 (10 ng/ml) for 22 hours. Graphs show total levels of LC3-I and LC3-II, relative to the corresponding levels in cells transfected with siCtrl and incubated without TGFβ1; n = 6 independent experiments. Data are presented as dots showing individual values and as means ± S.D. Statistical analysis in (A), (B), (C), (D) and (E) was performed using Wilcoxon’s rank–sum test. Statistical analysis in (G) and (H) was performed using one-way repeated measures ANOVA with the Tukey–Kramer post hoc test. *P < 0.05.