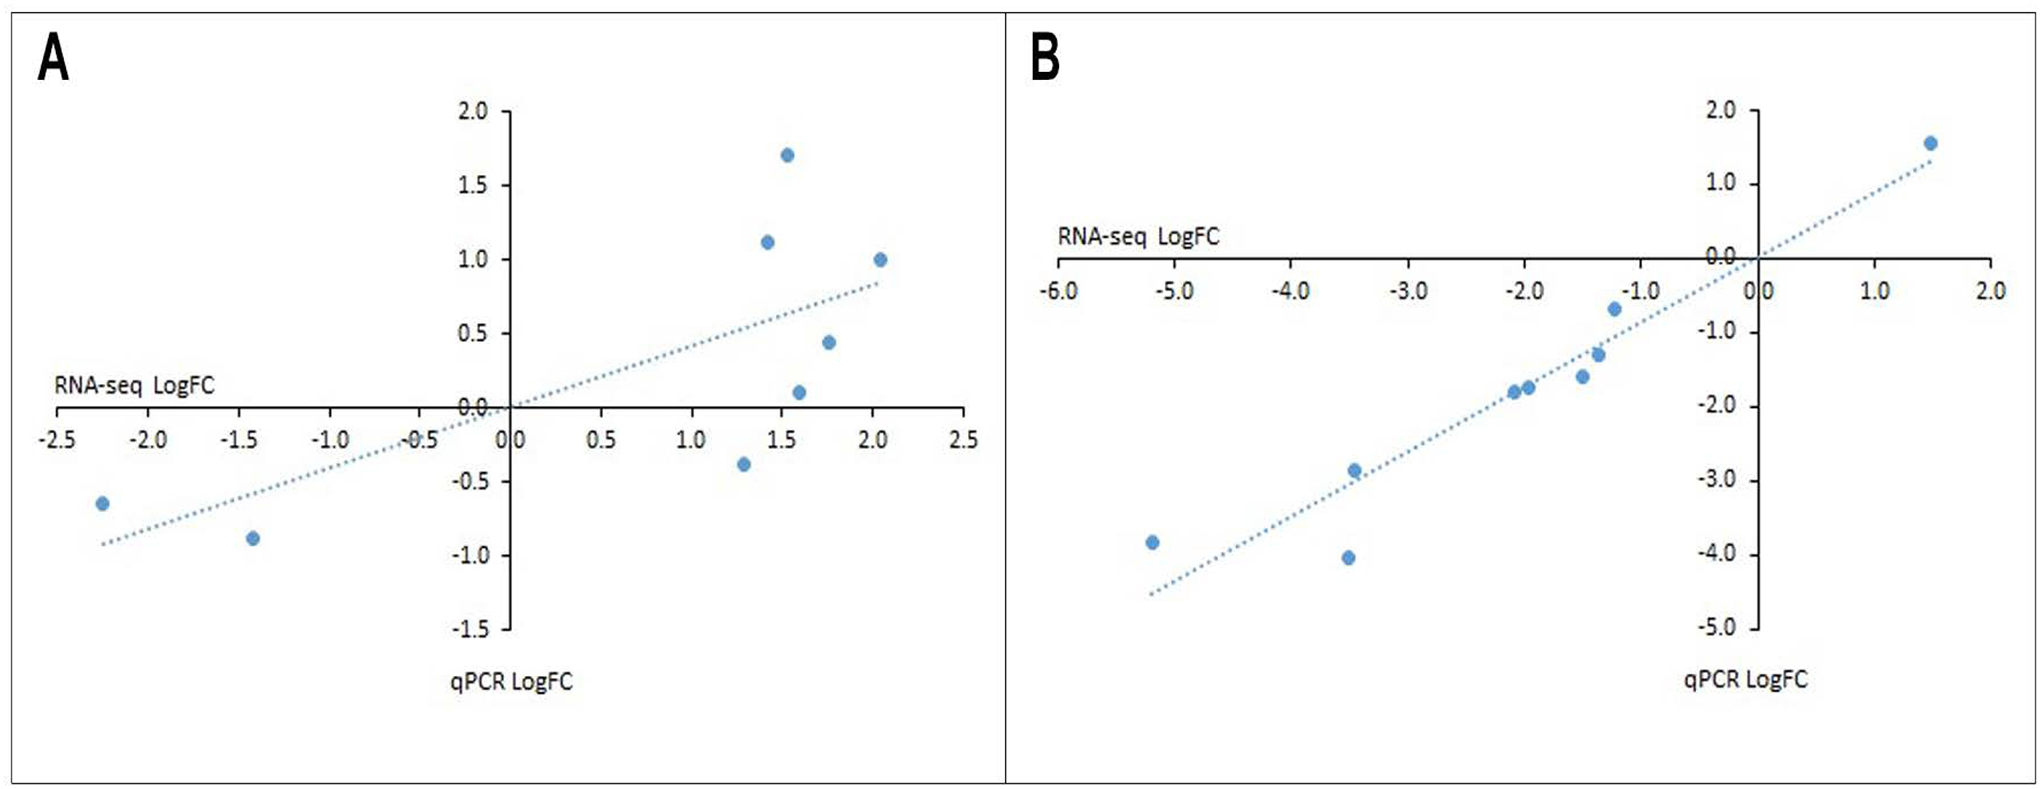
Figure 2: qPCR validation of RNA-seq data.

For skeletal muscle (A) and SCDMTs (B), qPCR validation was performed on the top 3 most significant genes from three different functional categories. Each point represents a single gene. Significant correlations between log2 fold change determined by RNA-seq and qPCR were observed for both tissue (Pearson’s r=0.723, p=0.043) and SCDMTs (Pearson’s r=0.960, p<0.001).
