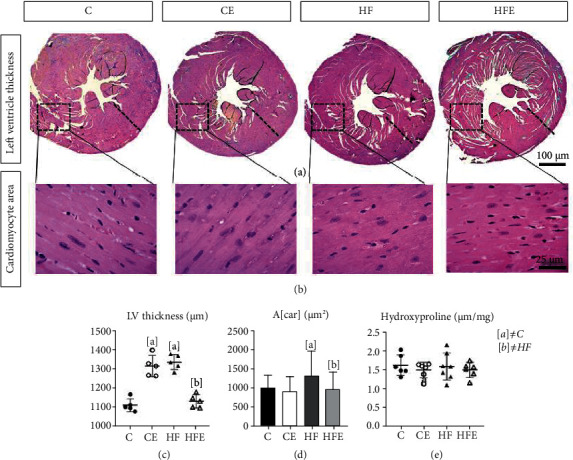
Figure 3.

(a) Left ventricular thickness, cross-section caudal view at the valvar plane showing the differences in the wall thickness. (b) Photomicrographs of the cardiomyocytes, paraffin sections stained by hematoxylin and eosin (×600). (c) Left ventricular thickness (μm). (d) Cross-sectional area of cardiomyocyte (A[car] (μm2)). (e) Hydroxyproline concentration in dry tissue of left ventricle. All data are presented as mean ± standard deviation, n = 5. C: control; CE: control with empagliflozin; HF: high fat; HFE: high fat with empagliflozin. [a] ≠C; [b] ≠HF. p < 0.05; one-way ANOVA and posttest Tamhane T2.
