FIGURE 2.

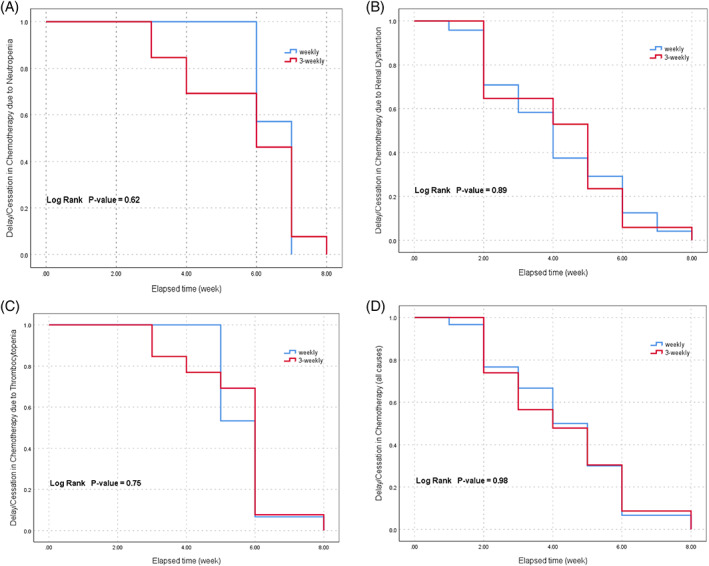
Kaplan–Meier curves of the time to occurrence of chemotherapy delay/cessation due to neutropenia (A), thrombocytopenia (B), renal dysfunction (C), and all three causes (D) in weekly and three‐weekly schedules

Kaplan–Meier curves of the time to occurrence of chemotherapy delay/cessation due to neutropenia (A), thrombocytopenia (B), renal dysfunction (C), and all three causes (D) in weekly and three‐weekly schedules