Figure 4.

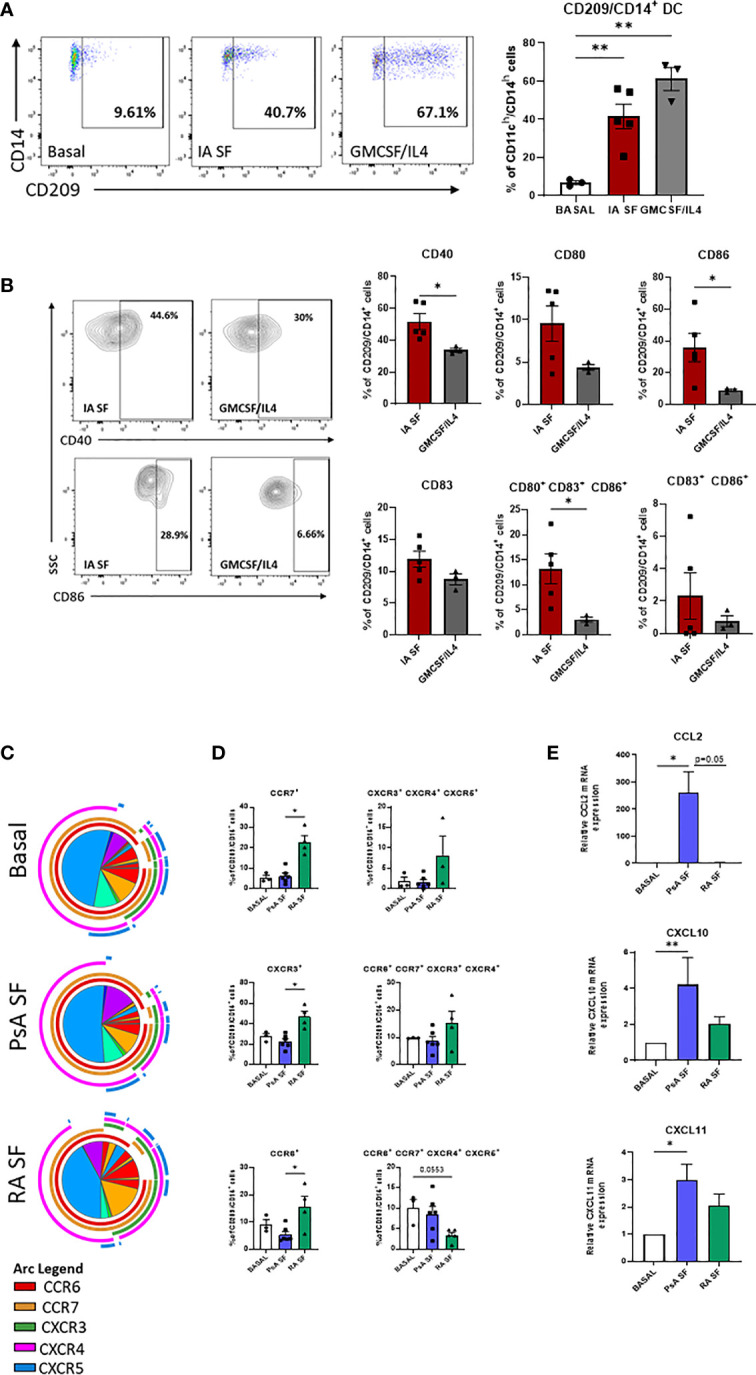
RA and PsA micro-environment modulate CD209/CD14+ DC development and activation. (A) Left, Representative flow plot of lineage negative cells from HC (n=2) left untreated (Basal n=3), treated with 20% IA synovial fluid (SF n=4), or with GMCSF/IL4 (n=3) cocktail. Right, histogram representing the frequency of CD209/CD14+ DC. Data are represented as mean ± SEM and differences among groups were evaluated by non-parametric One-way ANOVA. **p < 0.01. (B) histograms representing frequency of the maturation markers CD40, CD80, CD83, CD86 singularly expressed or combinations. Data are represented as mean ± SEM and differences among groups were evaluated by non-parametric t-test (Mann-Whitney test) *p < 0.05. (C) SPICE algorithm flow cytometric analysis of isolated CD209+ DC from HC left untreated (n=3) or stimulated with 20% SF from PsA (n=6) and RA (n=4), displaying the frequency of the chemokines receptors CCR6 (red arc), CCR7 (yellow arc), CXCR3 (green arc), CXCR4 (pink arc) and CXCR5 (blue arc) and (D) corresponding histograms representing the expression and co-expression of the chemokine receptors. Data are represented as mean ± SEM and differences among groups were evaluated by Non-parametric One-way ANOVA, Kruskal-Wallis test *p < 0.05. (E) qPCR displaying the relative gene expression of CCL2, CXCL10 and CXCL11 in isolated CD209+ DC from HC left untreated (n=4) or stimulated with 20% SF from PsA (n=5) and RA (n=5). Relative expression to basal was calculated with the 2–ΔΔCt method. Data are represented as mean ± SEM and differences among groups were evaluated by Non-parametric One-way ANOVA, Kruskal-Wallis test *p < 0.05, **p < 0.01.
