Figure 1.
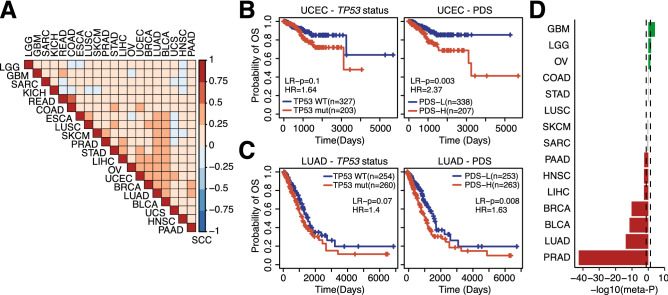
Prognostic associations in TCGA and PRECOG. (A) Correlation matrix of TP53 signatures using Spearman correlation coefficients (SCC). (B) KM plots for UCEC in TCGA based on TP53 mutation status (left) or p53 deficiency scores (PDS) (right). (C) KM plots for LUAD in TCGA based on TP53 mutation status (left) or PDS (right). LR p-value calculated between groups using Log-rang tests, HR hazard ratio. (D) Meta-p-values for association between PDSs and prognosis in PRECOG. Bars indicate − log10(meta p-values). Negative values indicate a hazardous role for PDSs, while positive values represent protective associations. LGG (brain lower grade glioma), GBM (glioblastoma multiforme), SARC (sarcoma), KICH (kidney chromophobe), READ (rectum adenocarcinoma), COAD (colon adenocarcinoma), ESCA (esophageal carcinoma), LUSC (lung squamous cell carcinoma), SKCM (skin cutaneous melanoma), PRAD (prostate adenocarcinoma), STAD (stomach adenocarcinoma), LIHC (liver hepatocellular carcinoma), OV (ovarian serous cystadenocarcinoma), UCEC (uterine corpus endometrial carcinoma), BRCA (breast invasive carcinoma), LUAD (lung adenocarcinoma), BLCA (bladder urothelial carcinoma), UCS (uterine carcinosarcoma), HNSC (head and neck squamous cell carcinoma), PAAD (pancreatic adenocarcinoma).

