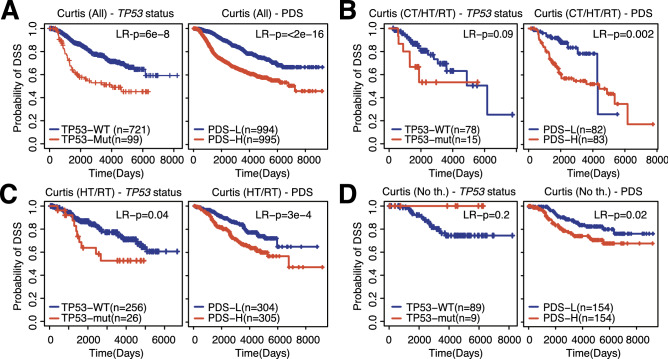
Figure 4.
PDSs in the METABRIC/Curtis dataset. (A) KM plot evaluating the association of TP53 mutation status (left) or PDS (right) with survival in the METABRIC/Curtis dataset (all patients). (B) Association of TP53 mutation status (left) or PDS (right) with survival for patients receiving a combination of chemotherapy therapy, hormone therapy, and radiotherapy. (C) Association of TP53 mutation status (left) or PDS (right) with survival for patients receiving a combination of hormone therapy and radiotherapy. (D) Association of TP53 mutation status (left) or PDS (right) with survival for patients not receiving any treatment. LR p-value calculated between TP53 groups using Log-rang tests, Cox-p p-value calculated using Coxph regression using PDSs as continuous variable, DSS disease-specific survival.

