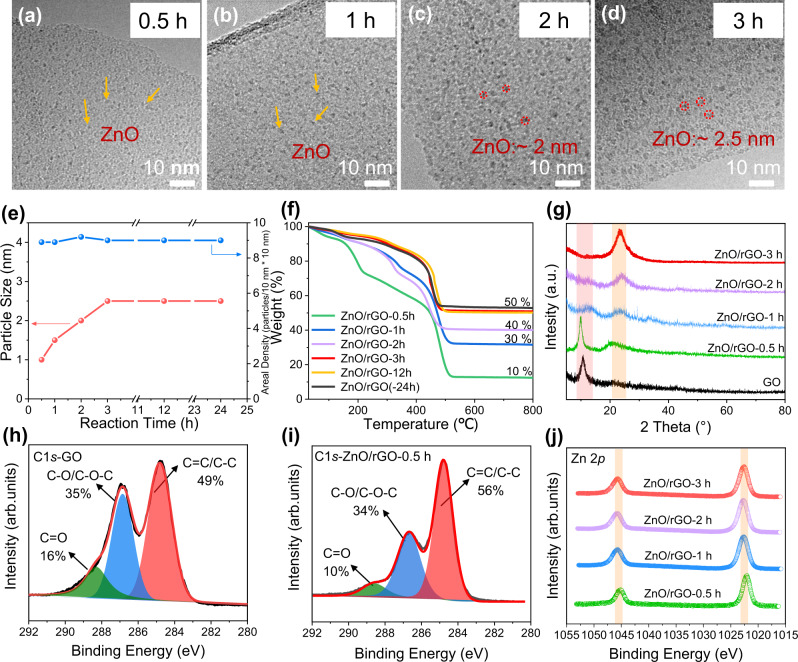
Fig. 2. Mechanism study of the formation of ultrafine ZnO nanoparticles on GO surface.
TEM images of (a) ZnO/rGO-0.5 h, (b) ZnO/rGO-1 h, (c) ZnO/rGO-2 h, and (d) ZnO/rGO-3 h. The yellow arrows and red circles refer to ZnO nanoparticles. e Graph of the average ZnO particle size and particle number density over time. f TGA curves of various samples. The residual weight of every sample after annealing in air at 800 °C refers to the ZnO contents in nanocomposites, which is given on the ride hand of every curve. g XRD spectra of various samples. The red and yellow shadings represent the XRD characteristic peak of GO and rGO, respectively. C1s XPS spectra of (h) GO, (i) ZnO/rGO-0.5 h. j Zn 2p XPS spectra of various samples. The yellow shadings represent the XPS characteristic peak of Zn 2p.

