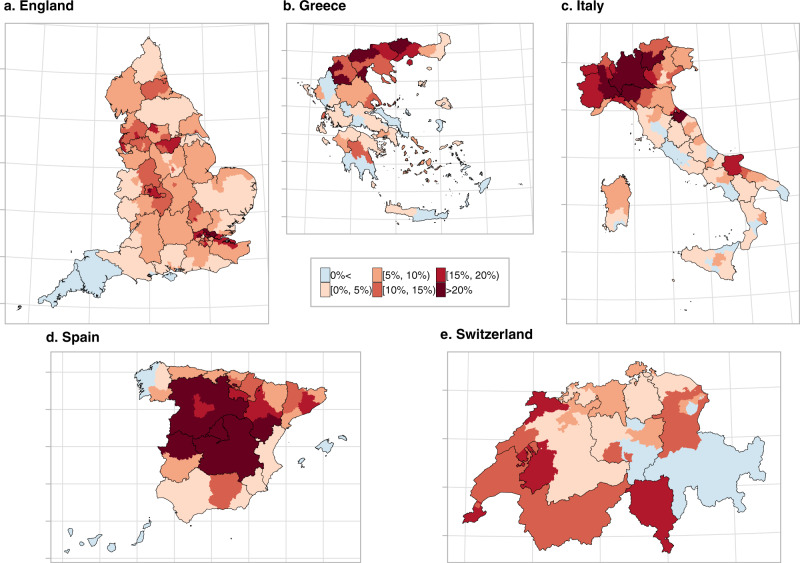
Fig. 2. Median relative excess deaths (%) by NUTS3 region in 2020.
a Median relative excess deaths (%) in England. b Median relative excess deaths (%) in Greece. c Median relative excess deaths (%) in Italy. d Median relative excess deaths (%) in Spain and e median relative excess deaths (%) in Switzerland in categories. Areas in blue indicate areas that observed less deaths than expected had the pandemic not occurred, whereas the different shades of red indicate the higher relative excess mortality. The black solid lines correspond to the NUTS2 region borders.

