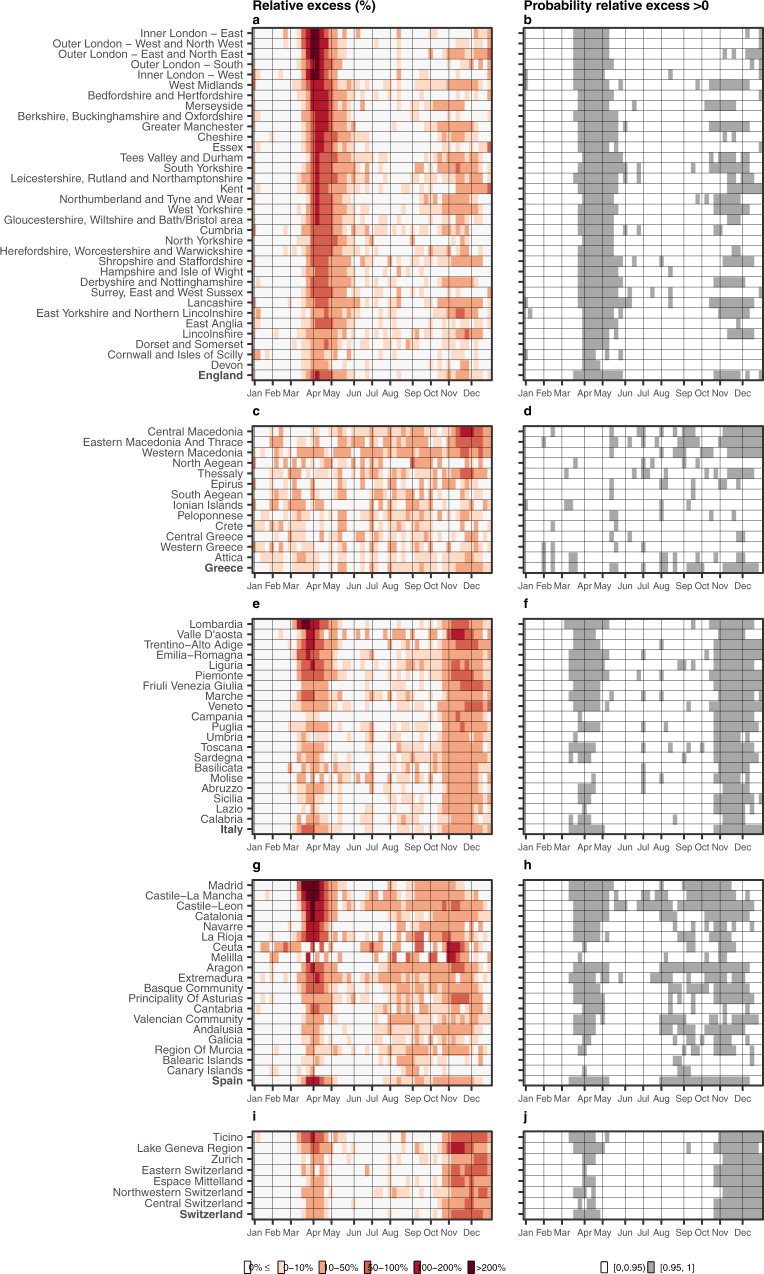
Fig. 4. Weekly median relative excess deaths (%) across the different countries by NUTS2 region in 2020 (left) and corresponding probability that the weekly relative excess is larger than 0% (right).
a Weekly median relative excess deaths in England. b Posterior probability that the relative excess is higher than 0% in England. c Weekly median relative excess deaths in Greece. d Posterior probability that the relative excess is higher than 0% in Greece. e Weekly median relative excess deaths in Italy. f Posterior probability that the relative excess is higher than 0% in Italy. g Weekly median relative excess deaths in Spain. h Posterior probability that the relative excess is higher than 0% in Spain. i Weekly median relative excess deaths in Switzerland and j posterior probability that the relative excess is higher than 0% in Switzerland. Different shades of red on the panels a, c, e, g and i indicate higher relative excess mortality, whereas the white ones relative excess mortality lower than 0%. The white colour on the panels b, d, f, h and j indicate insufficient evidence of a relative excess larger than 0%, whereas the grey strong evidence.

