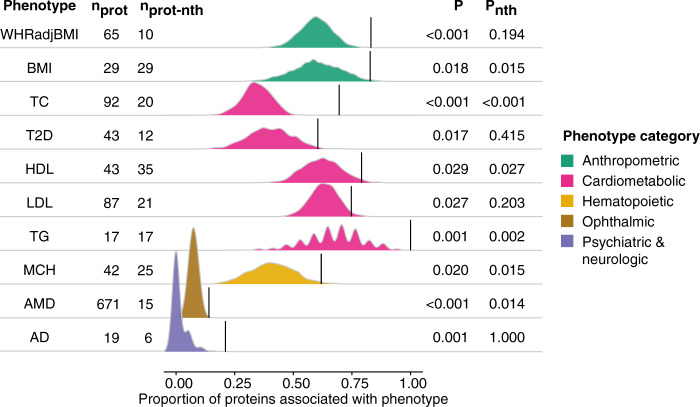
Fig. 5. Enrichment of phenotype associations among sets of colocalized proteins.
The ridgeline plot illustrates for each GWAS phenotype the proportion of colocalized proteins that were significantly associated with the same trait in AGES (linear regression, FDR < 0.05, n = 5457) (black lines) compared to 1000 randomly sampled sets of proteins of the same size (density curves), here showing only those with empirical P < 0.05. See full results in Supplementary Fig. 22. The number of colocalized proteins for each trait are provided on the left-hand side, along with the number of proteins remaining after the removal of proteins originating from loci with 5 or more colocalized proteins from the analysis, annotated as no trans hotspots (nth). Empirical P-values for significant enrichment of trait-associations are shown to the right. WHRadjBMI waist-to-hip ratio adjusted for BMI, TC total cholesterol, T2D type 2 diabetes, HDL high-density lipoprotein cholesterol, LDL low-density lipoprotein cholesterol, TG triglycerides, MCH mean corpuscular hemoglobin, AMD age-related macular degeneration, AD Alzheimer’s disease.

