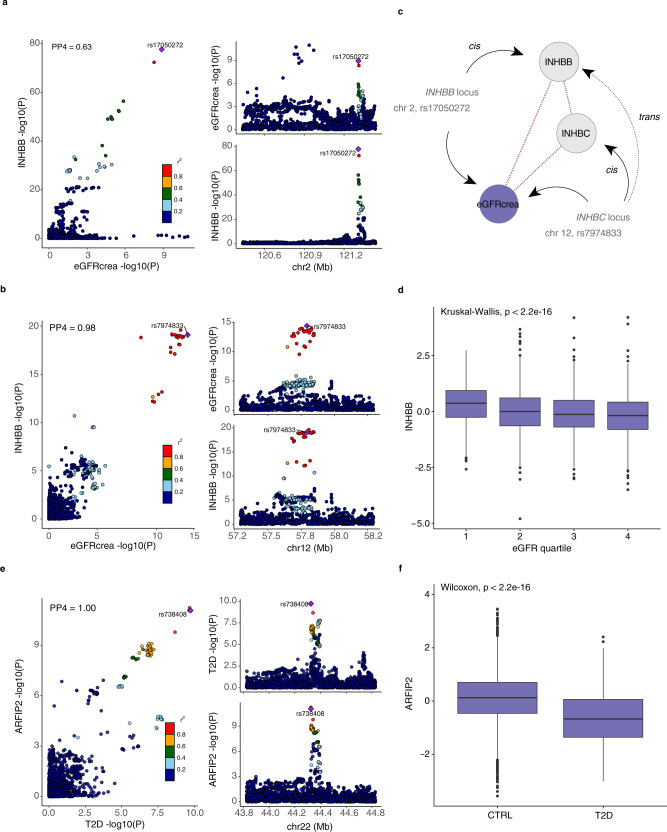
Fig. 6. Colocalization between GWAS signals for eGFR and INHBB and INHBC.
a Colocalization between GWAS signals (linear regression) at the INHBB locus on chromosome 2 and b the INHBC locus on chromosome 12 and eGFR. The PP4 value indicates the posterior probability for colocalization obtained from colocalization analysis. c A schematic diagram showing the convergence of genetic effects on serum levels of INHBB at the INHBB locus in cis and INHBC locus in trans. Variants in the INHBC locus furthermore affect INHBC serum levels in cis, albeit not reaching study-wide significance (P = 8.5 × 10⁻⁸, two-sided). Serum levels of INHBB and INHBC are positively correlated (Pearson’s r = 0.32, P = 3.4 × 10−130, two-sided), while both are negatively associated (linear regression) with eGFR (beta = −4.52, SE = 0.23, P = 1.3 × 10−82, two-sided, and beta = −2.62, SE = 0.22, P = 5.4 × 10⁻³², two-sided, respectively). d Boxplot showing INHBB serum levels in the AGES cohort (n = 5457) by eGFR quartiles. e Colocalization between a GWAS signals for T2D and a trans signal for ARFIP2 at the PNPLA3 locus on chromosome 22. f Boxplot showing ARFIP2 serum levels in the AGES cohort by T2D status (nT2D = 658, nCTRL = 4799). Boxplots in d and f indicate median value, 25th and 75th percentiles. Whiskers extend to smallest/largest value no further than 1.5× interquartile range. Outliers are shown.

